Randomized Controlled Trial
. 2019 Jul:84:30-38.
doi: 10.1016/j.ijid.2019.04.015. Epub 2019 Apr 19.

A pilot metabolomics study of tuberculosis immune reconstitution inflammatory syndrome

Affiliations
Randomized Controlled Trial

A pilot metabolomics study of tuberculosis immune reconstitution inflammatory syndrome

Carlos A M Silva et al. Int J Infect Dis. 2019 Jul.

Abstract

Background: Diagnosis of paradoxical tuberculosis-associated immune reconstitution inflammatory syndrome (TB-IRIS) is challenging and new tools are needed for early diagnosis as well as to understand the biochemical events that underlie the pathology in TB-IRIS.

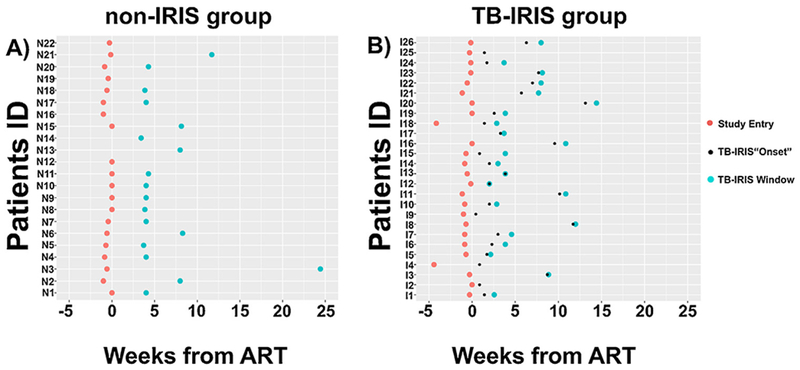
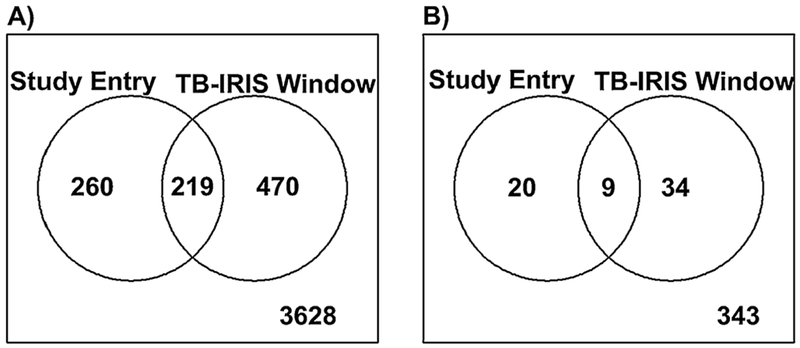
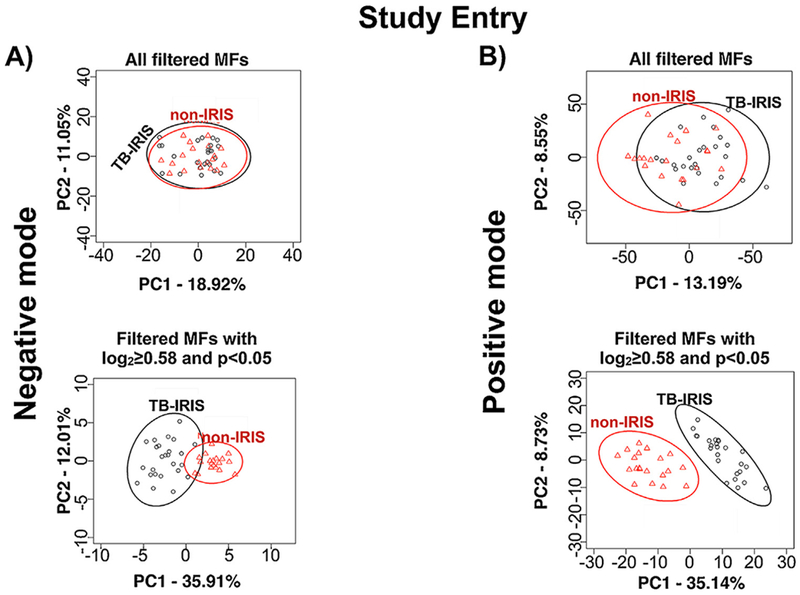
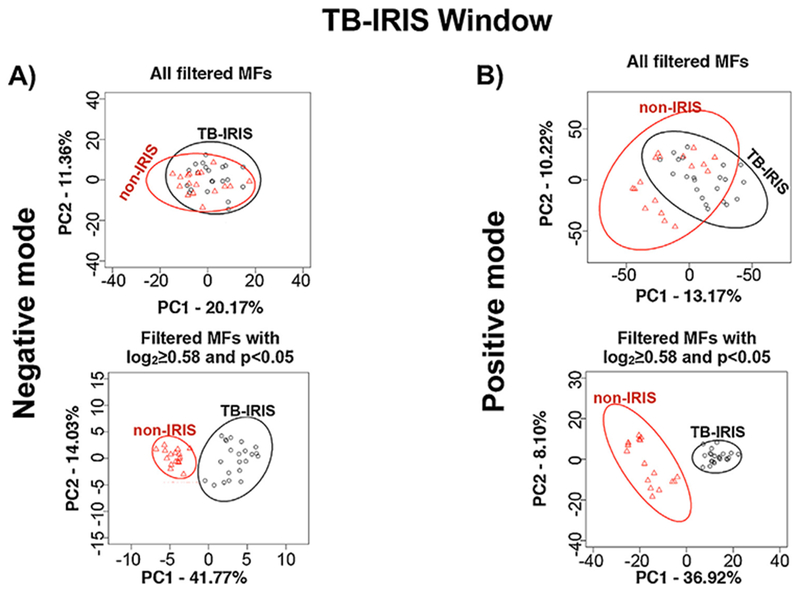
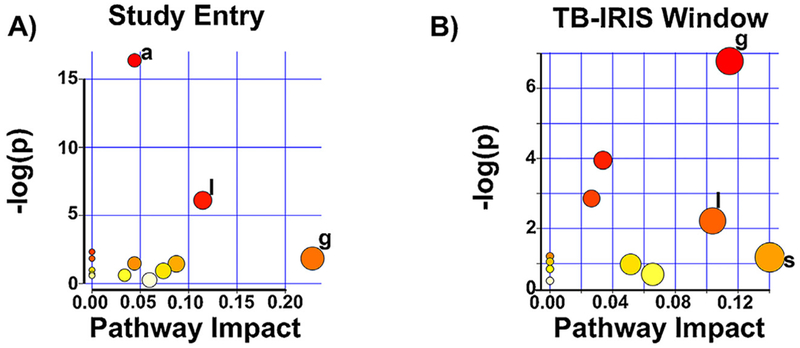
Methods: Plasma samples were obtained from participants from a randomized HIV/TB treatment strategy study (AIDS Clinical Trials Group [ACTG] A5221) with (n = 26) and without TB-IRIS (n = 22) for an untargeted metabolomics pilot study by liquid-chromatography mass spectrometry. The metabolic profile of these participants was compared at the study entry and as close to the diagnosis of TB-IRIS as possible (TB-IRIS window). Molecular features with p < 0.05 and log2 fold change ≥0.58 were submitted for pathway analysis through MetaboAnalyst. We also elucidated potential metabolic signatures for TB-IRIS using a LASSO regression model.

Results: At the study entry, we showed that the arachidonic acid and glycerophospholipid metabolism were altered in the TB-IRIS group. Sphingolipid and linoleic acid metabolism were the most affected pathways during the TB-IRIS window. LASSO modeling selected a set of 8 and 7 molecular features with the potential to predict TB-IRIS at study entry and during the TB-IRIS window, respectively.

Conclusion: This study suggests that the use of plasma metabolites may distinguish HIV-TB patients with and without TB-IRIS.

Keywords: AIDS; Biosignature features; IRIS; Metabolomics; Tuberculosis.


Conflict of interest statement

Conflict of interest

MD is currently a consultant to Crestone, Inc.

Figures

Figure 1.
Figure 1.
Time distribution of TB-IRIS and non-IRIS samples used. The time points (in weeks) that the plasma samples from the non-IRIS (A) and TB-IRIS (B) groups were collected with respect to the beginning of antiretroviral therapy (ART). Time point zero represents the beginning of ART. Red circles represent the first time in which the plasma samples were collected (Study Entry). None of the participants from the non-IRIS and TB-IRIS groups exhibited clinical symptoms of TB-IRIS at study entry. Small black circles represent the time points that participants from the TB-IRIS group were diagnosed with TB-IRIS (TB-IRIS “Onset”). Blue circles denote the time point for plasma collection within the TB-IRIS window (the time when TB-IRIS was diagnosed, with timing for the non-IRIS controls matched at the same time point). None of the participants from the non-IRIS group exhibited clinical symptoms of TB-IRIS.
Figure 2.
Figure 2.
Depiction of TB-IRIS differentiating molecular features (MFs) that were common or specific based on sample time point collection. The Venn diagrams show the overlap between the Study Entry and TB-IRIS Window time points for MFs with significant abundance differences (log2 fold change (FC) ≥0.58 and p < 0.05) between the TB-IRIS and non-IRIS groups. (A) MFs identified with the positive ion mode data. (B) MFs identified with the negative ion mode data.
Figure 3.
Figure 3.
Principal component analysis (PCA) of molecular features (MFs) that differentiate the TB-IRIS and non-IRIS groups at Study Entry (before the onset of TB-IRIS). PCA was performed with MFs identified in the negative (A) and positive (B) ion mode data. The LC-MS data files were analyzed by XCMS software and MFs that were submitted for further statistical analyses were selected based on filtering criteria (Supplemental Methods). The level of separation provided by all filtered MFs is shown in the PCA panels on top. The level of separation provided by those filtered MFs that differed significantly (log2 fold change (FC) ≥ 0.58 and p < 0.05) in abundance between TB-IRIS and non-IRIS groups are shown in the lower PCA panels.
Figure 4.
Figure 4.
Principal component analysis (PCA) of molecular features (MFs) that differentiate the TB-IRIS and non-IRIS groups at TB-IRIS Window. PCA was performed with MFs identified from the negative (A) and positive (B) ion mode data. The LC-MS data files were analyzed by XCMS software and MFs that were used for further statistical analysis were selected based on filtering criteria (Supplemental Methods). The level of separation provided by all filtered MFs is shown in the PCA panels on top. The level of separation provided by those filtered MFs that differed significantly (log2 fold change (FC) ≥ 0.58 and p <0.05) in abundance between TB-IRIS and non-IRIS groups are shown in the lower PCA panels.
Figure 5.
Figure 5.
Metabolic pathways predicted to be altered between participants that presented with TB-IRIS versus those that did not. Summary plots of metabolic pathways predicted to be altered between the TB-IRIS and non-IRIS participants based on enrichment (y-axis) and topology (x-axis) analyses are shown. The significance and impact of specific metabolic pathways differs for TB-IRIS versus non-IRIS pathways at the two time points evaluated. Study Entry (A) and TB-IRIS Window (B). −log(p) is the negative natural log of the raw p values (p values not corrected for multiple comparison analysis). Only pathways with p < 0.05 and/or pathway impact value > 0.10 are marked. g = glycerophospholipid metabolism; l = linoleic acid metabolism; a = arachidonic acid metabolism; s = sphingolipid metabolism.

Similar articles

Cited by

References

    1. Aittokallio T, Schwikowski B. Graph-based methods for analysing networks in cell biology. Brief Bioinform 2006;7(3):243–55. - PubMed
    1. Al-Mubarak R, Vander Heiden J, Broeckling CD, Balagon M, Brennan PJ, Vissa VD. Serum metabolomics reveals higher levels of polyunsaturated fatty acids in lepromatous leprosy: potential markers for susceptibility and pathogenesis. PLoS Ngl Trop Dis 2011;5(9):e1303. - PMC - PubMed
    1. Andrade PR, Pinheiro RO, Sales AM, Illarramendi X, Barbosa MG, Moraes MO, et al. Type 1 reaction in leprosy: a model for a better understanding of tissue immunity under an immunopathological condition. Expert Rev Clin Immunol 2015;11(3):391–407. - PubMed
    1. Awodele O, Olayemi SO, Nwite JA, Adeyemo TA. Investigation of the levels of oxidative stress parameters in HIV and HIV-TB co-infected patients.J Infect Dev Ctries 2012;6(1):79–85. - PubMed
    1. Barber DL, Andrade BB, Sereti I, Sher A. Immune reconstitution inflammatory syndrome: the trouble with immunity when you had none. Nat Rev Microbiol 2012;10(2):150–6. - PMC - PubMed

Publication types

Substances