. 2019 Aug 15;28(16):2659-2674.
doi: 10.1093/hmg/ddz084.

Placental DNA methylation levels at CYP2E1 and IRS2 are associated with child outcome in a prospective autism study

Affiliations

Placental DNA methylation levels at CYP2E1 and IRS2 are associated with child outcome in a prospective autism study

Yihui Zhu et al. Hum Mol Genet. .

Abstract

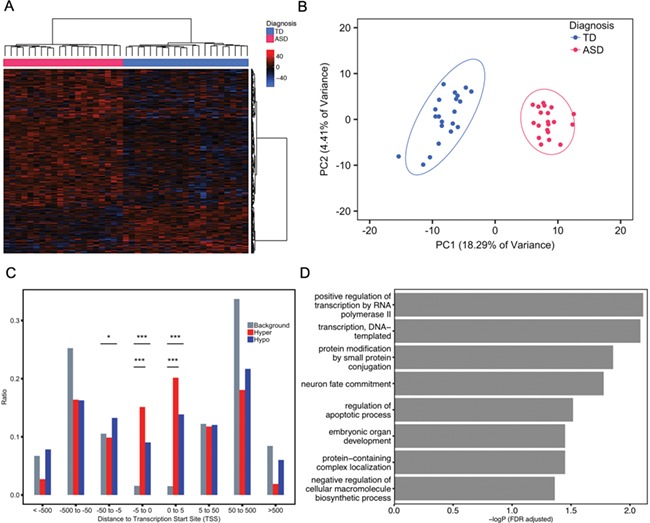
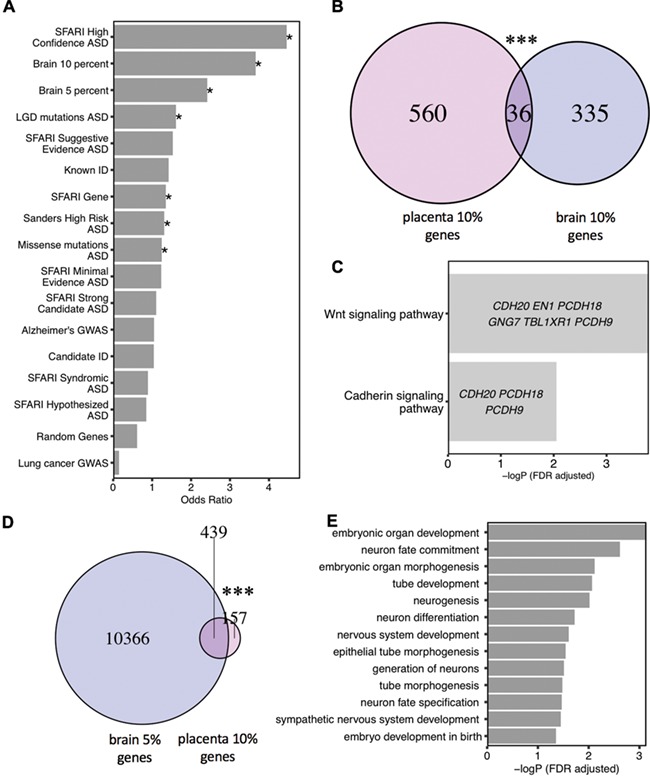
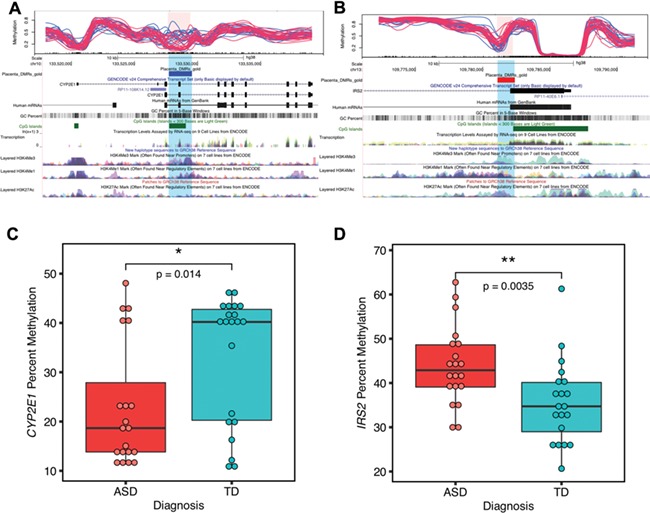
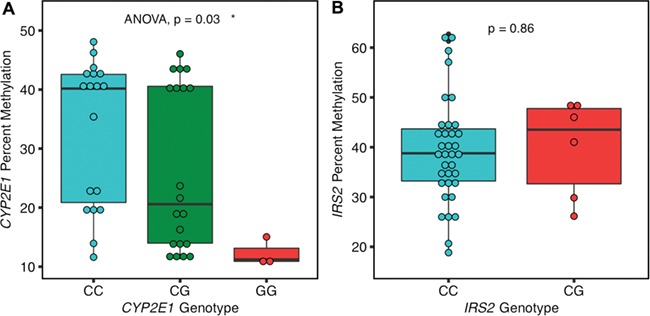
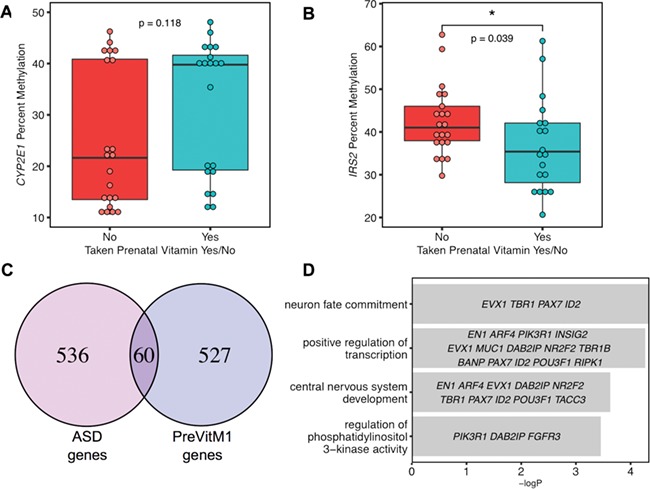
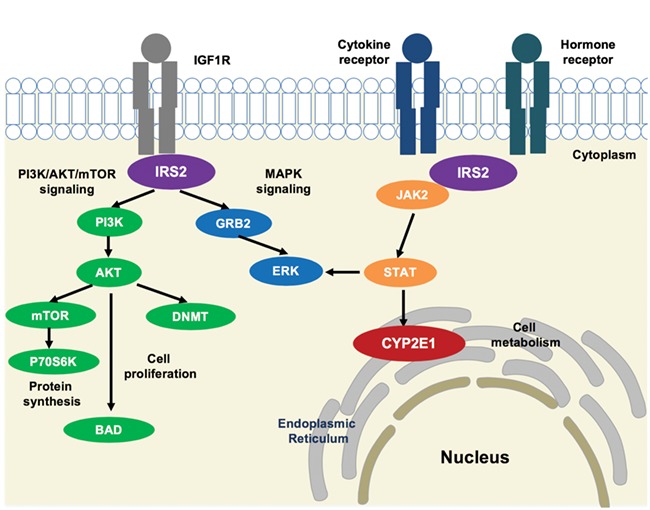
DNA methylation acts at the interface of genetic and environmental factors relevant for autism spectrum disorder (ASD). Placenta, normally discarded at birth, is a potentially rich source of DNA methylation patterns predictive of ASD in the child. Here, we performed whole methylome analyses of placentas from a prospective study MARBLES (Markers of Autism Risk in Babies-Learning Early Signs) of high-risk pregnancies. A total of 400 differentially methylated regions (DMRs) discriminated placentas stored from children later diagnosed with ASD compared to typically developing controls. These ASD DMRs were significantly enriched at promoters, mapped to 596 genes functionally enriched in neuronal development, and overlapped genetic ASD risk. ASD DMRs at CYP2E1 and IRS2 reached genome-wide significance, replicated by pyrosequencing and correlated with expression differences in brain. Methylation at CYP2E1 associated with both ASD diagnosis and genotype within the DMR. In contrast, methylation at IRS2 was unaffected by within DMR genotype but modified by preconceptional maternal prenatal vitamin use. This study therefore identified two potentially useful early epigenetic markers for ASD in placenta.


Figures

Figure 1
Figure 1
DMRs in placenta distinguished ASD from TD child outcomes. (A) Heatmap and hierarchical clustering of 20 ASD versus 21 TD placental samples using methylation levels in the 400 identified ASD DMRs. Percent methylation for each sample relative to the mean methylation at each ASD DMR was plotted as a heatmap, with black representing no difference, hyper-methylation (red) and hypo-methylation (blue). Columns were clustered by child outcome, ASD (red) or TD (blue), while rows were clustered by methylation direction. (B) PCA of TD versus ASD placental samples on the basis of methylation at 400 ASD DMRs. Ellipses represent the 95% confidence interval for each group. The non-overlapping ellipses showed a significant difference between ASD and TD for these DMRs’ methylation level (P < 0.05). (C) Location relative to genes for hypermethylated (red) or hypomethylated (blue) ASD DMRs compared to background (grey). Distributions of locations relative to transcription start sites (TSS) are shown on the x-axis. The ratio plotted on the y-axis is calculated by the number of genes at each binned location divided by the total number of genes (Supplementary Material, Table 5). *P < 0.05, **P < 0.01, ***P < 0.001 by Fisher’s exact test. (D) Bar graph represents the significant results from gene ontology and pathway enrichment analysis of ASD DMRs associated genes compared to background by Fisher’s exact test (FDR adjusted -log P-value, x-axis).
Figure 2
Figure 2
Placenta ASD DMR genes overlapped with ASD DMR associated genes from postmortem brain and known genetic risk for ASD but not for other disorders. (A) Placenta ASD DMR associated genes were compared for significant overlap with ASD DMR genes identified from ASD postmortem brain (33) (based on 10% or 5% methylation difference cutoffs), as well as multiple curated gene lists of ASD, ID or unrelated disorder genetic risks or a randomly generated gene list (*P < 0.05 FDR corrected two-tailed Fisher’s exact test, ranked by odds ratio). SFARI: Simons Foundation Autism Research Initiative (34), LGD: likely gene-disrupting mutation, ASD: autism spectrum disorder, Alzheimer: Alzheimer’s Disease, ID: intellectual disability. (B) Venn diagram represents the significant overlap of 36 genes associated with placenta ASD DMRs and brain ASD DMRs based on 10% methylation differences in brain between ASD versus TD by Fisher’s exact test (P < 0.001***) (Supplementary Material, Table 7). Methylation data from human postmortem brain was obtained from previous published data sets, GSE8154 (ASD and TD) (33). (C) GO and pathway analysis on the 36 genes in common between placenta ASD DMRs and brain ASD DMRs associated genes. Enrichment tests were done on Fisher’s exact test with FDR 0.05 correction. Genes in each GO term are shown within each bar. (D) Venn diagram represents significant overlap of 439 genes between placenta ASD DMRs and DMRs from brain with 5% methylation difference between ASD and TD (Fisher’s exact test, P < 0.001***) (Supplementary Material, Table 7). (E) Multiple developmental pathways were significantly enriched on the overlapped 439 genes with Fisher’s exact test after FDR 0.05 correction.
Figure 3
Figure 3
Placenta ASD DMRs were enriched at H3K4me3 regions, flanking promoter regions and CpG shores. (A) Placenta ASD DMRs were examined for enrichment with histone modification ChIP-seq peaks from the Epigenome Roadmap using the LOLA package. Enrichments are plotted as the odds ratio in a heat map for each of eight different tissue types and six types of modified histone marks (107). (B) Enrichment tests on chromatin states from chromHMM categories in the Epigenome Roadmap and placental ASD DMRs from this study were performed using LOLA, with each row representing a different ChromHMM predicted state and each column a single tissue type. (C) Placenta ASD DMRs (categorized as all, hypermethylated or hypomethylated in ASD) were tested for enrichment based on CpG island location. The human genome was separated into CpG islands, CpG shores, CpG shelves and open sea.
Figure 4
Figure 4
Two genome-wide significant placental DMRs located at CYP2E1 and IRS2 were validated by pyrosequencing. (A) and (B) show the location relative to genes and CpG islands of the two genome-wide significant DMRs (highlighted in pink and blue) in the UCSC Genome Browser. In the upper tracks, each line represents percent methylation (y-axis) of a single individual by WGBS analysis. Blue lines represent TD, and red lines represent ASD samples. (A) Hypomethylated DMR at CYP2E1 with 10 kb upstream and 10 kb downstream. (B) Hypermethylated DMR at IRS2 with 10 kb upstream and 10 kb downstream. (C) The CYP2E1 DMR percent methylation was significantly associated with child outcome and verified by pyrosequencing (two-tailed t-test, P = 0.014). The y-axis represents the average percent DNA methylation across the DMR regions from pyrosequencing. Each dot represented one sample. (D) Pyrosequencing validation on IRS2 DMR’s methylation with child outcome (two-tailed t-test, P = 0.0035). *P < 0.05, **P < 0.01.
Figure 5
Figure 5
Cis genotype was significantly associated with CYP2E1 but not IRS2 DMR methylation levels.( A) CYP2E1 genotype at rs1536828 within the ASD DMR was significantly associated with CYP2E1 DMR average percent methylation tested by ANOVA (P = 0.03). (B) IRS2 genotype at rs9301411 within the ASD DMR was not significantly associated with IRS2 DMR methylation by two-tailed t-test (P = 0.86).
Figure 6
Figure 6
Preconception prenatal vitamin use was a significant modifier of IRS2 methylation and associated DMRs overlapped ASD DMRs in placenta. For (A) and (B), the x-axis represents maternal prenatal vitamins use during the first month of pregnancy, while the y-axis shows the percent methylation. (A) CYP2E1 DMR methylation was not significantly altered by P1 prenatal vitamin use. (B) Higher percent methylation at IRS2 DMR was significantly associated with not taking prenatal vitamins at P1 (two-tailed t-test, P = 0.039), which is in the same direction as ASD risk. (C) DMRs identified based on P1 prenatal vitamins use were associated with 587 genes, which showed a significant overlap with ASD DMR associated genes (Fisher’s exact test, P < 2.528e-16). (D) GO and pathway analysis were performed on the overlapped gene list (60 genes) (Supplementary Material, Table 11) between placenta ASD DMR and P1 prenatal vitamin DMR-associated genes for enrichment by Fisher’s exact test with -log (P-value) represented on the x-axis. Genes in each GO term are shown within each bar.
Figure 7
Figure 7
Potential pathway convergence of proteins encoded by both ASD DMRs. IRS2 interacts with transmembrane protein IGF1R at the intracellular membrane, resulting in activation of the PI3K/AKT/mTOR and MAPK signaling pathways involved in protein synthesis, cell proliferation and gene expression (81). An AKT-mediated ubiquitin pathway leads to de novo DNA methylation changes by DNMT (84). IRS2 also interacts with cytokine and hormone receptors and induces JAK2/STAT3 signaling (81,83). STAT activation leads to CYP2E1 localization at the endoplasmic reticulum, changing cellular metabolism (74).

Similar articles

Cited by

References

    1. Baio J., Wiggins L., Christensen D.L., Maenner M.J., Daniels J., Warren Z., Kurzius-Spencer M., Zahorodny W., Robinson Rosenberg C., White T. et al. (2018) Prevalence of autism spectrum disorder among children aged 8 years—autism and developmental disabilities monitoring network, 11 sites, United States, 2014. MMWR. Surveill. Summ., 67,–23. - PMC - PubMed
    1. Tsai P.C. and Bell J.T. (2015) Power and sample size estimation for epigenome-wide association scans to detect differential DNA methylation. Int. J. Epidemiol., 44,1429–1441. - PMC - PubMed
    1. Wessels W.H. and Pompe van Meerdervoort M. (1979) Monozygotic twins with early infantile autism. A case report. S. Afr. Med. J., 55, 955–957. - PubMed
    1. Hannon E., Knox O., Sugden K., Burrage J., Wong C.C.Y., Belsky D.W., Corcoran D.L., Arseneault L., Moffitt T.E., Caspi A. et al. (2018) Characterizing genetic and environmental influences on variable DNA methylation using monozygotic and dizygotic twins. PLoS Genet., 14, e1007544. - PMC - PubMed
    1. Bourgeron T. (2015) From the genetic architecture to synaptic plasticity in autism spectrum disorder. Nat. Rev. Neurosci., 16, 551–563. - PubMed

Publication types

MeSH terms