. 2019 Apr 21;11(4):568.
doi: 10.3390/cancers11040568.

MSC.sTRAIL Has Better Efficacy than MSC.FL-TRAIL and in Combination with AKTi Blocks Pro-Metastatic Cytokine Production in Prostate Cancer Cells

Affiliations

MSC.sTRAIL Has Better Efficacy than MSC.FL-TRAIL and in Combination with AKTi Blocks Pro-Metastatic Cytokine Production in Prostate Cancer Cells

Andrea Mohr et al. Cancers (Basel). .

Abstract

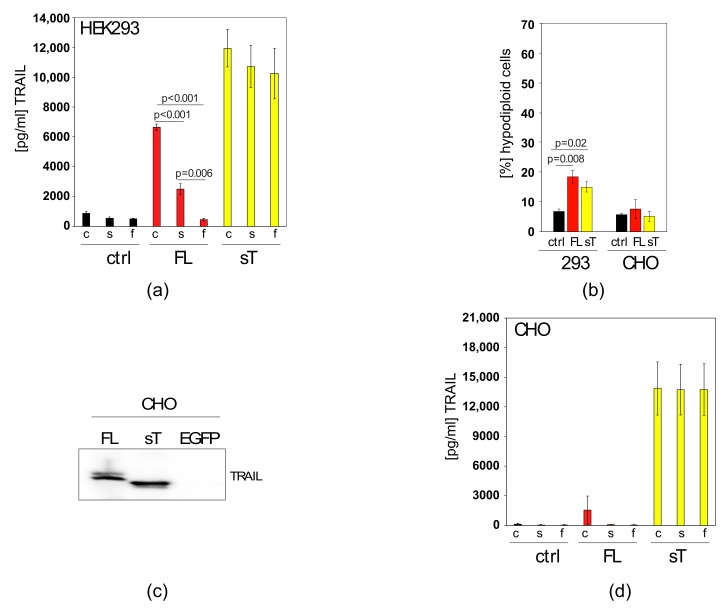
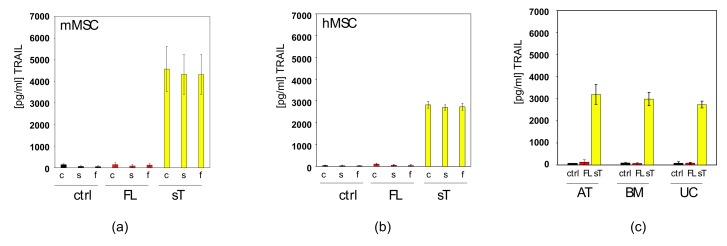
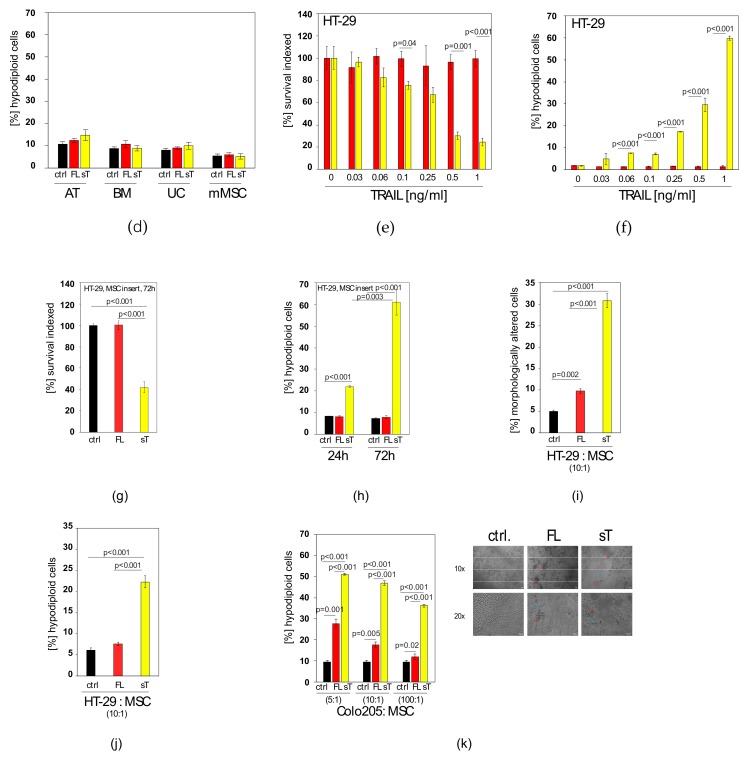
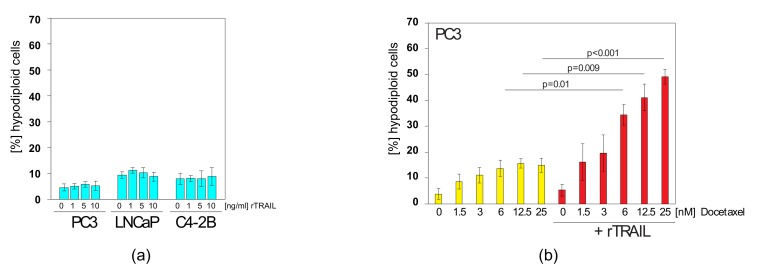
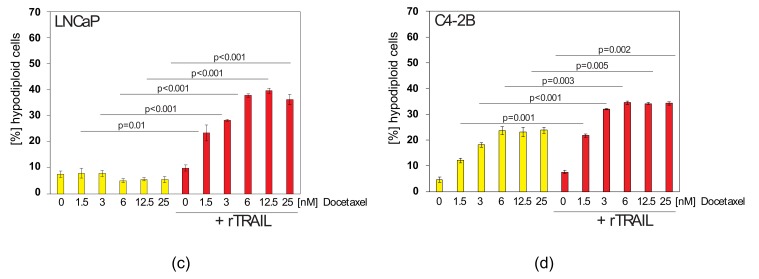
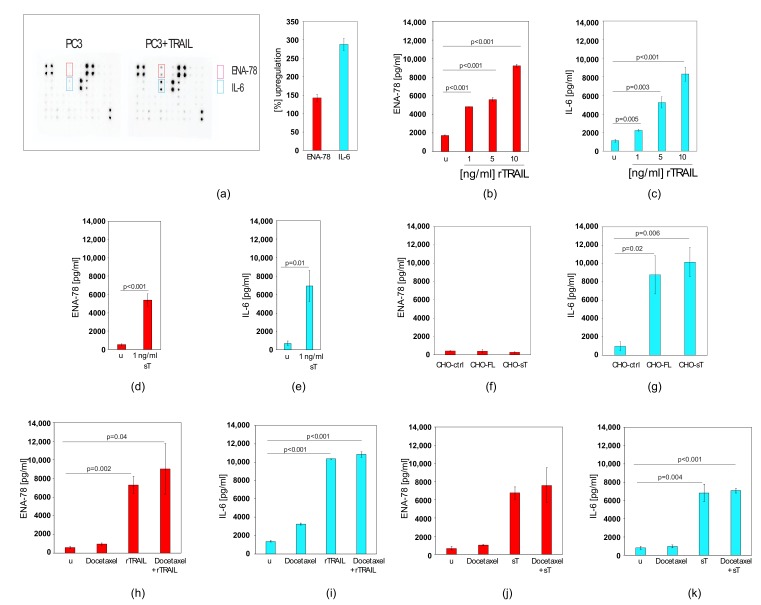
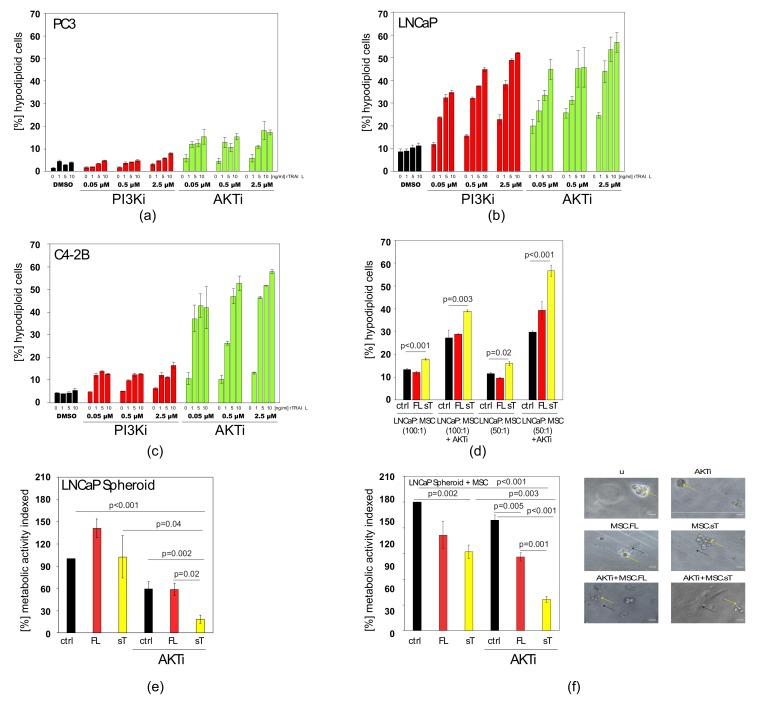
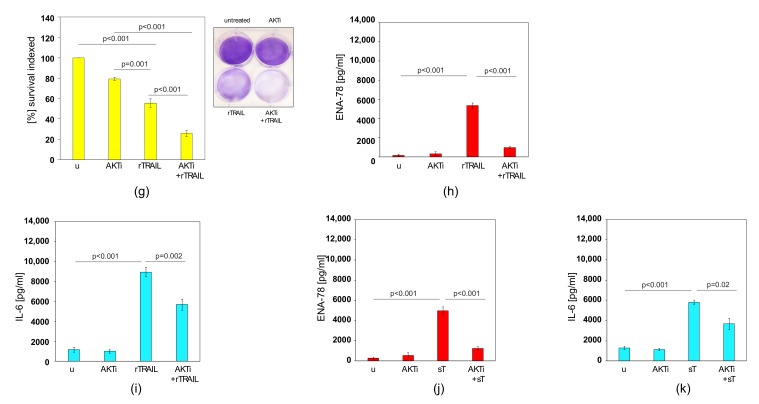
Cell therapy is a promising new treatment option for cancer. In particular, mesenchymal stem cells (MSCs) have shown potential in delivering therapeutic genes in various tumour models and are now on the verge of being tested in the clinic. A number of therapeutic genes have been examined in this context, including the death ligand TRAIL. For cell therapy, it can be used in its natural form as a full-length and membrane-bound protein (FL-TRAIL) or as an engineered version commonly referred to as soluble TRAIL (sTRAIL). As to which is more therapeutically efficacious, contradicting results have been reported. We discovered that MSCs producing sTRAIL have significantly higher apoptosis-inducing activity than cells expressing FL-TRAIL and found that FL-TRAIL, in contrast to sTRAIL, is not secreted. We also demonstrated that TRAIL does induce the expression of pro-metastatic cytokines in prostate cancer cells, but that this effect could be overcome through combination with an AKT inhibitor. Thus, a combination consisting of small-molecule drugs specifically targeting tumour cells in combination with MSC.sTRAIL, not only provides a way of sensitising cancer cells to TRAIL, but also reduces the issue of side-effect-causing cytokine production. This therapeutic strategy therefore represents a novel targeted treatment option for advanced prostate cancer and other difficult to treat tumours.

Keywords: AKT; AKTi; CXCL5; ENA-78; IL-6; cell therapy; mesenchymal stem cells; prostate cancer; sTRAIL.


Conflict of interest statement

The authors declare no conflicts of interest.

Figures

Figure 1
Figure 1
FL-TRAIL and sTRAIL are expressed in HEK293 cells, but only sTRAIL is secreted into the supernatant. (a) Schematic depiction of full length, membrane bound TRAIL (FL) and soluble TRAIL (sT) expression cassettes including depiction of the localisation of the two TRAIL forms when expressed in cells. The full-length version is the TRAIL cDNA corresponding to aa1-aa281 containing a cytoplasmic part (C), transmembrane region (TM) and the extracellular domain. The sTRAIL construct consists of a hFIB heterologous signal peptide, a Furin cleavage site (Furin CS), an Isoleucine Zipper (ILZ) and the sTRAIL part from aa114–281. Both constructs are under the control of the CMV promoter within pcDNA3 expression plasmids or adenoviral vectors. (b) HEK293 cells were transfected with pCDNA3 constructs for EGFP, FL-TRAIL (FL) or sTRAIL (sT). The resulting protein lysates were western blotted and probed with a TRAIL antibody. (c) HEK293 cells were transfected with an empty pCDNA3 plasmid (ctrl), as well as constructs for FL-TRAIL (FL) and secreted TRAIL (sT), respectively. The cells were then stained with a TRAIL antibody followed by a secondary antibody carrying a PE fluorescent tag and analysed by flow cytometry. (d) HEK293 cells were transfected with expression constructs for FL-TRAIL (FL), secreted TRAIL (sT) or an empty plasmid (ctrl). After 48 h the supernatants were filtered through a 0.45 μm filter and the resulting filtrates used for a TRAIL ELISA. Values represent mean ± SE.
Figure 2
Figure 2
In apoptosis-sensitive, FL-TRAIL expressing cells, TRAIL appears in the supernatant owing to apoptosis, but not secretion (a) HEK293 cells were transfected with an empty plasmid (ctrl), a FL-TRAIL construct (FL) or an sTRAIL (sT) construct. The resulting medium supernatants were either taken as crude supernatants (c), centrifuged (s) or filtered through a 0.45 μm filter (f) before TRAIL levels were measured by ELISA (b) Apoptosis was measured in HEK293 and CHO cells that were transfected with an empty plasmid (ctrl), an FL-TRAIL construct (FL) or an sTRAIL construct (sT). (c) CHO cells were transfected with pCDNA3 constructs expressing FL-TRAIL (FL), sTRAIL (sT) or EGFP. The resulting protein lysates were subjected to western blotting. The membrane was then probed with a TRAIL antibody. (d) CHO cells were transfected with an empty plasmid (ctrl), a FL-TRAIL construct (FL) or an sTRAIL (sT) construct. The resulting medium supernatants were either taken as crude supernatants (c), centrifuged (s) or filtered through a 0.45 μm filter (f) before TRAIL levels were measured by ELISA. Values represent mean ± SE.
Figure 3
Figure 3
MSC.sTRAIL induces higher apoptosis levels in colorectal cancer cells than MSC.FL-TRAIL. (a) Murine MSCs (mMSCs) were transduced with a control adenoviral vector (ctrl), a vector expressing FL-TRAIL (FL) or a vector expressing sTRAIL (sT). The resulting medium supernatants were either taken as crude supernatants (c), centrifuged (s) or filtered through a 0.45 μm filter (f) before TRAIL levels were measured by ELISA. (b) Human MSCs (hMSCs) were transduced with a control adenoviral vector (ctrl), a vector expressing FL-TRAIL (FL) or a vector expressing sTRAIL (sT). The resulting medium supernatants were either taken as crude supernatants (c), centrifuged (s) or filtered through a 0.45 μm filter (f) before TRAIL levels were measured by ELISA. (c) Different types of MSCs (adipose tissue-derived - AT, bone marrow-derived - BM, and umbilical cord-derived - UC) were transduced with a control adenoviral vector (ctrl), a vector expressing FL-TRAIL (FL) or a vector expressing sTRAIL (sT). The resulting medium supernatants were passed through a 0.45 μm filter before TRAIL levels were measured by ELISA. (d) Apoptosis was measured in different types of MSCs, adipose tissue-derived (AT), bone marrow-derived (BM) and umbilical cord-derived (UC) and mouse (mMSC) MSCs that were transduced with a control adenoviral vector (ctrl), a vector expressing FL-TRAIL (FL) or a vector expressing sTRAIL (sT). (e) Survival was measured in HT-29 cells after exposure to supernatants from MSC.FL-TRAIL (red) and MSC.sTRAIL (yellow) at increasing concentrations of sTRAIL. For MSC.FL-TRAIL supernatants equal volumes of supernatant were used for each corresponding sTRAIL concentration. (f) Apoptosis was measured in HT-29 cells after exposure to supernatants from MSC.FL-TRAIL (red) and MSC.sTRAIL (yellow) at increasing concentrations of sTRAIL. For MSC.FL-TRAIL supernatants equal volumes of supernatant were used for each corresponding sTRAIL concentration. (g) Survival was measured in HT-29 cells that were co-cultured with control MSCs (ctrl), MSC.FL-TRAIL (FL) or MSC.sTRAIL (sT) in 24-well plates fitted with transwell tissue culture inserts. (h) Apoptosis was measured at 24 h and 72 h in HT-29 cells. For this HT-29 cells were co-cultured with control MSCs (ctrl), MSC.FL-TRAIL (FL) or MSC.sTRAIL (sT) in 24-well plates fitted with transwell tissue culture inserts. (i) Morphologically altered cells were measured by flow cytometry (changes in FSC/SSC) after mixing HT-29 cells with control MSCs (ctrl), MSC.FL-TRAIL (FL) or MSC.sTRAIL (sT) at a ratio of 10:1. (j) Apoptosis measurements of HT-29 cells mixed with control MSCs (ctrl), MSC.FL-TRAIL (FL) or MSC.sTRAIL (sT) at a ratio of 10:1. (k) Apoptosis measurements of Colo205 cells mixed with control MSCs (ctrl), MSC.FL-TRAIL (FL) or MSC.sTRAIL (sT) at different ratios (5:1; 10:1; 100:1). Representative images of Colo205 cells mixed with control MSCs (ctrl), MSC.FL-TRAIL (FL) or MSC.sTRAIL (sT) are shown on the right side of the panel. MSCs are pointed out by blue arrows, apoptotic cells by red arrows. Scale bar is 30 μm. Values represent mean ± SE.
Figure 3
Figure 3
MSC.sTRAIL induces higher apoptosis levels in colorectal cancer cells than MSC.FL-TRAIL. (a) Murine MSCs (mMSCs) were transduced with a control adenoviral vector (ctrl), a vector expressing FL-TRAIL (FL) or a vector expressing sTRAIL (sT). The resulting medium supernatants were either taken as crude supernatants (c), centrifuged (s) or filtered through a 0.45 μm filter (f) before TRAIL levels were measured by ELISA. (b) Human MSCs (hMSCs) were transduced with a control adenoviral vector (ctrl), a vector expressing FL-TRAIL (FL) or a vector expressing sTRAIL (sT). The resulting medium supernatants were either taken as crude supernatants (c), centrifuged (s) or filtered through a 0.45 μm filter (f) before TRAIL levels were measured by ELISA. (c) Different types of MSCs (adipose tissue-derived - AT, bone marrow-derived - BM, and umbilical cord-derived - UC) were transduced with a control adenoviral vector (ctrl), a vector expressing FL-TRAIL (FL) or a vector expressing sTRAIL (sT). The resulting medium supernatants were passed through a 0.45 μm filter before TRAIL levels were measured by ELISA. (d) Apoptosis was measured in different types of MSCs, adipose tissue-derived (AT), bone marrow-derived (BM) and umbilical cord-derived (UC) and mouse (mMSC) MSCs that were transduced with a control adenoviral vector (ctrl), a vector expressing FL-TRAIL (FL) or a vector expressing sTRAIL (sT). (e) Survival was measured in HT-29 cells after exposure to supernatants from MSC.FL-TRAIL (red) and MSC.sTRAIL (yellow) at increasing concentrations of sTRAIL. For MSC.FL-TRAIL supernatants equal volumes of supernatant were used for each corresponding sTRAIL concentration. (f) Apoptosis was measured in HT-29 cells after exposure to supernatants from MSC.FL-TRAIL (red) and MSC.sTRAIL (yellow) at increasing concentrations of sTRAIL. For MSC.FL-TRAIL supernatants equal volumes of supernatant were used for each corresponding sTRAIL concentration. (g) Survival was measured in HT-29 cells that were co-cultured with control MSCs (ctrl), MSC.FL-TRAIL (FL) or MSC.sTRAIL (sT) in 24-well plates fitted with transwell tissue culture inserts. (h) Apoptosis was measured at 24 h and 72 h in HT-29 cells. For this HT-29 cells were co-cultured with control MSCs (ctrl), MSC.FL-TRAIL (FL) or MSC.sTRAIL (sT) in 24-well plates fitted with transwell tissue culture inserts. (i) Morphologically altered cells were measured by flow cytometry (changes in FSC/SSC) after mixing HT-29 cells with control MSCs (ctrl), MSC.FL-TRAIL (FL) or MSC.sTRAIL (sT) at a ratio of 10:1. (j) Apoptosis measurements of HT-29 cells mixed with control MSCs (ctrl), MSC.FL-TRAIL (FL) or MSC.sTRAIL (sT) at a ratio of 10:1. (k) Apoptosis measurements of Colo205 cells mixed with control MSCs (ctrl), MSC.FL-TRAIL (FL) or MSC.sTRAIL (sT) at different ratios (5:1; 10:1; 100:1). Representative images of Colo205 cells mixed with control MSCs (ctrl), MSC.FL-TRAIL (FL) or MSC.sTRAIL (sT) are shown on the right side of the panel. MSCs are pointed out by blue arrows, apoptotic cells by red arrows. Scale bar is 30 μm. Values represent mean ± SE.
Figure 4
Figure 4
Docetaxel can sensitise TRAIL-resistant prostate cancer cells to the apoptosis-inducing effects of TRAIL. (a) PC3, LNCaP and C4-2B cells were treated with increasing concentrations of rTRAIL before apoptosis was measured. (b) PC3 cells were treated with increasing concentrations of docetaxel as indicated or treated with docetaxel/TRAIL mixes. TRAIL was used at 5 ng/mL. (c) LNCaP cells were treated with increasing concentrations of docetaxel as indicated or treated with docetaxel/TRAIL mixes. TRAIL was used at 5 ng/mL. (d) C4-2B cells were treated with increasing concentrations of docetaxel as indicated or treated with docetaxel/TRAIL mixes. TRAIL was used at 5 ng/mL. Values represent mean ± SE.
Figure 4
Figure 4
Docetaxel can sensitise TRAIL-resistant prostate cancer cells to the apoptosis-inducing effects of TRAIL. (a) PC3, LNCaP and C4-2B cells were treated with increasing concentrations of rTRAIL before apoptosis was measured. (b) PC3 cells were treated with increasing concentrations of docetaxel as indicated or treated with docetaxel/TRAIL mixes. TRAIL was used at 5 ng/mL. (c) LNCaP cells were treated with increasing concentrations of docetaxel as indicated or treated with docetaxel/TRAIL mixes. TRAIL was used at 5 ng/mL. (d) C4-2B cells were treated with increasing concentrations of docetaxel as indicated or treated with docetaxel/TRAIL mixes. TRAIL was used at 5 ng/mL. Values represent mean ± SE.
Figure 5
Figure 5
TRAIL induces the expression of CXCL5/ENA-78 and IL-6 that cannot be prevented by docetaxel co-treatment. (a) Cytokine arrays of untreated PC3 cells and PC3 cells treated with rTRAIL. The diagram on the right shows the quantification of the factors that were induced by rTRAIL (>50%). (b) CXCL5/ENA-78 ELISA results of supernatants from PC3 cells (u) and PC3 cells treated with increasing concentrations of rTRAIL. (c) IL-6 ELISA results of supernatants from PC3 cells (u) and PC3 cells treated with increasing concentrations of rTRAIL. (d) CXCL5/ENA-78 ELISA results of supernatants from PC3 cells (u) and PC3 cells treated with 1 ng/mL sTRAIL from MSCs. (e) IL-6 ELISA results of supernatants from PC3 cells (u) and PC3 cells treated with 1 ng/mL sTRAIL from MSCs. (f) CXCL5/ENA-78 ELISA results of supernatants from PC3 cells mixed with control transfected CHO cells (CHO-ctrl), PC3 cells mixed with FL-TRAIL expressing CHO cells (CHO-FL) and PC3 cells mixed with sTRAIL expressing CHO cells (CHO-sT). (g) IL-6 ELISA results of supernatants from PC3 cells mixed with control transfected CHO cells (CHO-ctrl), PC3 cells mixed with FL-TRAIL expressing CHO cells (CHO-FL) and PC3 cells mixed with sTRAIL expressing CHO cells (CHO-sT). (h) CXCL5/ENA-78 ELISA results of supernatants from untreated PC3 cells (u), PC3 cells treated with docetaxel, treated with rTRAIL or treated with a mix of docetaxel and rTRAIL. (i) IL-6 ELISA results of supernatants from untreated PC3 cells (u), PC3 cells treated with docetaxel, treated with rTRAIL or treated with a mix of docetaxel and rTRAIL. (j) CXCL5/ENA-78 ELISA results of supernatants from untreated PC3 cells (u), PC3 cells treated with docetaxel, treated with sTRAIL from MSCs or treated with a mix of docetaxel and sTRAIL. sTRAIL was used at 1 ng/mL, docetaxel was used at 12.5 nM. (k) IL-6 ELISA results of supernatants from untreated PC3 cells (u), PC3 cells treated with docetaxel, treated with sTRAIL or treated with a mix of docetaxel and sTRAIL. sTRAIL was used at 1 ng/mL, docetaxel was used at 12.5 nM. Values represent mean ± SE.
Figure 6
Figure 6
AKTi can sensitise prostate cancer cells to TRAIL and block cytokine production. (a) Apoptosis was measured in PC3 cells that were treated with increasing concentrations of PI3Ki or AKTi and co-treated with increasing concentrations of rTRAIL. DMSO is a vehicle control. (b) Apoptosis was measured in LNCaP cells that were treated with increasing concentrations of PI3Ki or AKTi and co-treated with increasing concentrations of rTRAIL. DMSO is a vehicle control. (c) Apoptosis was measured in C4-2B cells that were treated with increasing concentrations of PI3Ki or AKTi and co-treated with increasing concentrations of rTRAIL. DMSO is a vehicle control. (d) Apoptosis measurement of LNCaP cells mixed with control MSCs (ctrl), MSC.FL-TRAIL (FL) or MSC.sTRAIL (sT) at different ratios (50:1; 100:1) either with or without AKTi. (e) LNCaP cells were grown as 3D spheroids and then treated with supernatants from control MSCs (ctrl), full-length TRAIL (FL) MSCs and sTRAIL (sT) MSCs plus AKTi, before cell viability was assessed. (f) LNCaP cells were grown as spheroids in Matrigel and then treated with control MSCs (ctrl), MSC.FL-TRAIL (FL) and MSC.sTRAIL (sT) plus AKTi, before cell viability was assessed. The right panel shows representative images. Spheroids are indicated by yellow arrows, MSCs by black arrows. Scale bar is 30 μm. (g) Measurements of survival of untreated PC3 cells (u), PC3 cells treated with AKTi, treated with rTRAIL or treated with a mix of AKTi and rTRAIL. A representative image of these measurements is shown on the right side. (h) CXCL5/ENA-78 ELISA results of supernatants of untreated PC3 cells (u), PC3 cells treated with AKTi, treated with rTRAIL or treated with a mix of AKTi and rTRAIL. (i) IL-6 ELISA results of supernatants of untreated PC3 cells (u), PC3 cells treated with AKTi, treated with rTRAIL or treated with a mix of AKTi and rTRAIL. (j) CXCL5/ENA-78 ELISA results of supernatants of untreated PC3 cells (u), PC3 cells treated with AKTi, treated with sTRAIL (sT) from MSCs or treated with a mix of AKTi and sTRAIL (sT). (k) IL-6 ELISA results of supernatants of untreated PC3 cells (u), PC3 cells treated with AKTi, treated with sTRAIL (sT) or treated with a mix of AKTi and sTRAIL (sT). Values represent mean ± SE.
Figure 6
Figure 6
AKTi can sensitise prostate cancer cells to TRAIL and block cytokine production. (a) Apoptosis was measured in PC3 cells that were treated with increasing concentrations of PI3Ki or AKTi and co-treated with increasing concentrations of rTRAIL. DMSO is a vehicle control. (b) Apoptosis was measured in LNCaP cells that were treated with increasing concentrations of PI3Ki or AKTi and co-treated with increasing concentrations of rTRAIL. DMSO is a vehicle control. (c) Apoptosis was measured in C4-2B cells that were treated with increasing concentrations of PI3Ki or AKTi and co-treated with increasing concentrations of rTRAIL. DMSO is a vehicle control. (d) Apoptosis measurement of LNCaP cells mixed with control MSCs (ctrl), MSC.FL-TRAIL (FL) or MSC.sTRAIL (sT) at different ratios (50:1; 100:1) either with or without AKTi. (e) LNCaP cells were grown as 3D spheroids and then treated with supernatants from control MSCs (ctrl), full-length TRAIL (FL) MSCs and sTRAIL (sT) MSCs plus AKTi, before cell viability was assessed. (f) LNCaP cells were grown as spheroids in Matrigel and then treated with control MSCs (ctrl), MSC.FL-TRAIL (FL) and MSC.sTRAIL (sT) plus AKTi, before cell viability was assessed. The right panel shows representative images. Spheroids are indicated by yellow arrows, MSCs by black arrows. Scale bar is 30 μm. (g) Measurements of survival of untreated PC3 cells (u), PC3 cells treated with AKTi, treated with rTRAIL or treated with a mix of AKTi and rTRAIL. A representative image of these measurements is shown on the right side. (h) CXCL5/ENA-78 ELISA results of supernatants of untreated PC3 cells (u), PC3 cells treated with AKTi, treated with rTRAIL or treated with a mix of AKTi and rTRAIL. (i) IL-6 ELISA results of supernatants of untreated PC3 cells (u), PC3 cells treated with AKTi, treated with rTRAIL or treated with a mix of AKTi and rTRAIL. (j) CXCL5/ENA-78 ELISA results of supernatants of untreated PC3 cells (u), PC3 cells treated with AKTi, treated with sTRAIL (sT) from MSCs or treated with a mix of AKTi and sTRAIL (sT). (k) IL-6 ELISA results of supernatants of untreated PC3 cells (u), PC3 cells treated with AKTi, treated with sTRAIL (sT) or treated with a mix of AKTi and sTRAIL (sT). Values represent mean ± SE.

Similar articles

Cited by

References

    1. Duiker E.W., Mom C.H., de Jong S., Willemse P.H., Gietema J.A., van der Zee A.G., de Vries E.G. The clinical trail of trail. Eur. J. Cancer. 2006;42:2233–2240. doi: 10.1016/j.ejca.2006.03.018. - DOI - PubMed
    1. Lemke J., von Karstedt S., Zinngrebe J., Walczak H. Getting trail back on track for cancer therapy. Cell Death Differ. 2014;21:1350–1364. doi: 10.1038/cdd.2014.81. - DOI - PMC - PubMed
    1. Micheau O., Shirley S., Dufour F. Death receptors as targets in cancer. Br. J. Pharm. 2013;169:1723–1744. doi: 10.1111/bph.12238. - DOI - PMC - PubMed
    1. Wiley S.R., Schooley K., Smolak P.J., Din W.S., Huang C.P., Nicholl J.K., Sutherland G.R., Smith T.D., Rauch C., Smith C.A., et al. Identification and characterization of a new member of the tnf family that induces apoptosis. Immunity. 1995;3:673–682. doi: 10.1016/1074-7613(95)90057-8. - DOI - PubMed
    1. Wu G.S. Trail as a target in anti-cancer therapy. Cancer Lett. 2009;285:1–5. doi: 10.1016/j.canlet.2009.02.029. - DOI - PubMed