

DNA methylation dynamics during epigenetic reprogramming of medaka embryo
- PMID: 31010368
- PMCID: PMC6557613
- DOI: 10.1080/15592294.2019.1605816
DNA methylation dynamics during epigenetic reprogramming of medaka embryo
Abstract
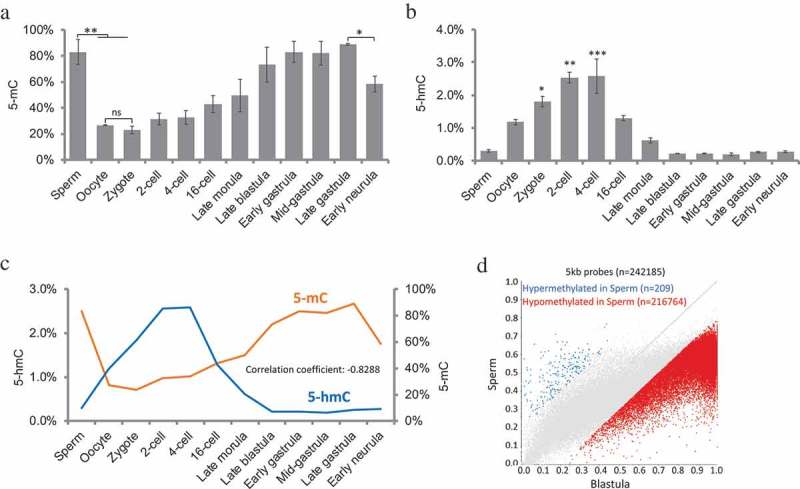
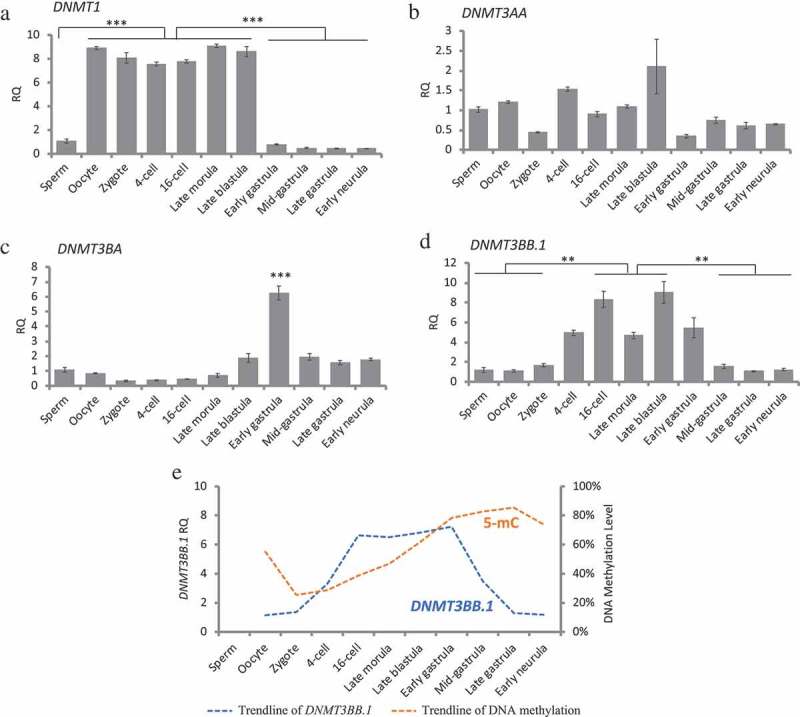
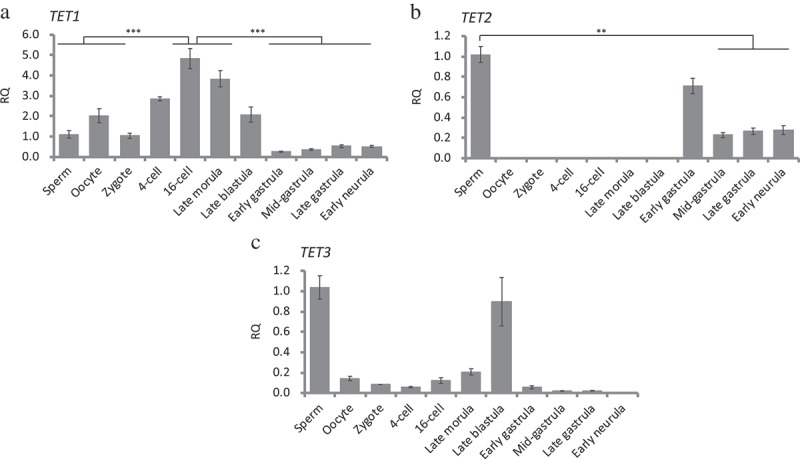
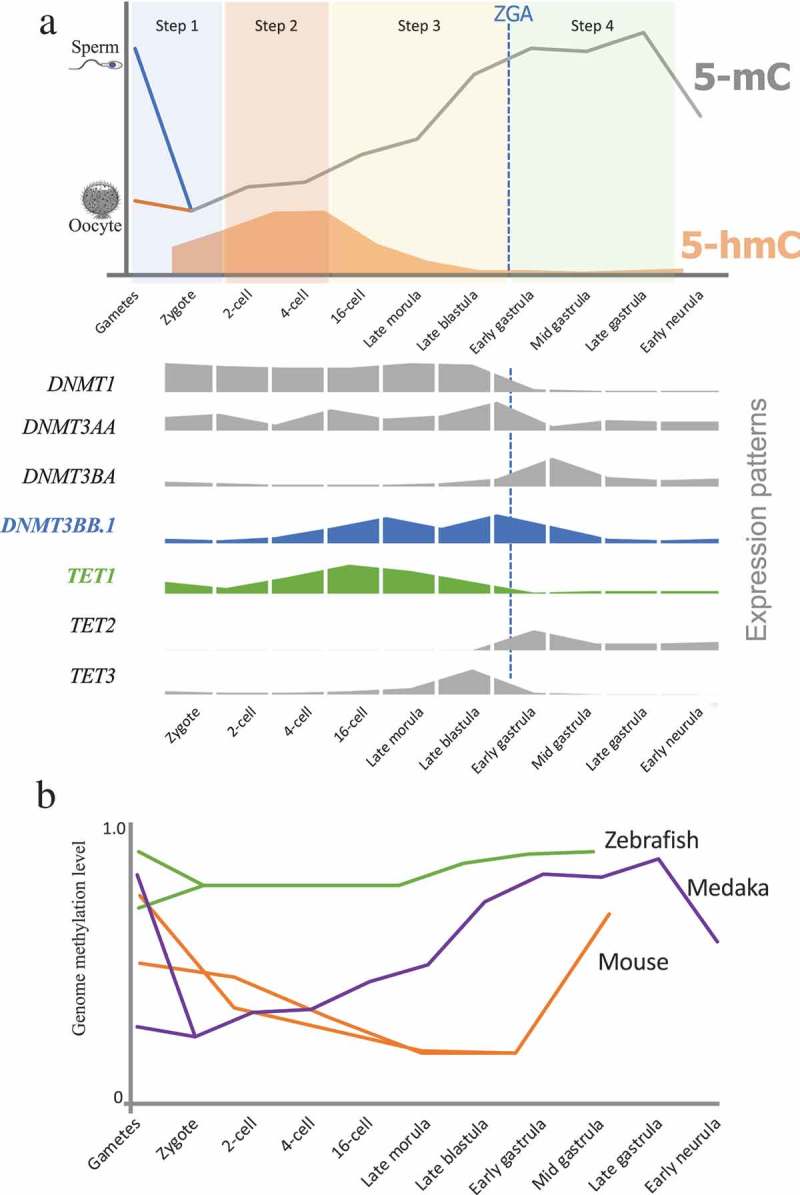
Post-fertilization epigenome reprogramming erases epigenetic marks transmitted through gametes and establishes new marks during mid-blastula stages. The mouse embryo undergoes dynamic DNA methylation reprogramming after fertilization, while in zebrafish, the paternal DNA methylation pattern is maintained throughout the early embryogenesis and the maternal genome is reprogrammed in a pattern similar to that of sperm during the mid-blastula transition. Here, we show DNA methylation dynamics in medaka embryos, the biomedical model fish, during epigenetic reprogramming of embryonic genome. The sperm genome was hypermethylated and the oocyte genome hypomethylated prior to fertilization. After fertilization, the methylation marks of sperm genome were erased within the first cell cycle and embryonic genome remained hypomethylated from the zygote until 16-cell stage. The DNA methylation level gradually increased from 16-cell stage through the gastrula. The 5-hydroxymethylation (5hmC) levels showed an opposite pattern to DNA methylation (5-mC). The mRNA levels for DNA methyltransferase (DNMT) 1 remained high in oocytes and maintained the same level through late blastula stage and was reduced thereafter. DNMT3BB.1 mRNA levels increased prior to remethylation. The mRNA levels for ten-eleven translocation methylcytosine dioxygenases (TET2 & TET3) were detected in sperm and embryos at cleavage stages, whereas TET1 and TET3 mRNAs decreased during gastrulation. The pattern of genome methylation in medaka was identical to mammalian genome methylation but not to zebrafish. The present study suggests that a medaka embryo resets its DNA methylation pattern by active demethylation and by a gradual remethylation similar to mammals.
Keywords: DNA methylation; Epigenetic reprogramming; medaka embryo.
Figures
Similar articles
-
The role of Tet3 DNA dioxygenase in epigenetic reprogramming by oocytes.Nature. 2011 Sep 4;477(7366):606-10. doi: 10.1038/nature10443. Nature. 2011. PMID: 21892189
-
The dynamics of DNA methylation during epigenetic reprogramming of primordial germ cells in medaka (Oryzias latipes).Epigenetics. 2020 May;15(5):483-498. doi: 10.1080/15592294.2019.1695341. Epub 2019 Dec 18. Epigenetics. 2020. PMID: 31851575 Free PMC article.
-
Aberrant Epigenetic Reprogramming in the First Cell Cycle of Bovine Somatic Cell Nuclear Transfer Embryos.Cell Reprogram. 2021 Apr;23(2):99-107. doi: 10.1089/cell.2020.0079. Cell Reprogram. 2021. PMID: 33861636
-
Reprogramming DNA methylation in the mammalian life cycle: building and breaking epigenetic barriers.Philos Trans R Soc Lond B Biol Sci. 2013 Jan 5;368(1609):20110330. doi: 10.1098/rstb.2011.0330. Philos Trans R Soc Lond B Biol Sci. 2013. PMID: 23166394 Free PMC article. Review.
-
DNA Methylation Reprogramming during Mammalian Development.Genes (Basel). 2019 Mar 29;10(4):257. doi: 10.3390/genes10040257. Genes (Basel). 2019. PMID: 30934924 Free PMC article. Review.
Cited by
-
Medaka liver developed Human NAFLD-NASH transcriptional signatures in response to ancestral bisphenol A exposure.Res Sq [Preprint]. 2024 Jul 16:rs.3.rs-4585175. doi: 10.21203/rs.3.rs-4585175/v1. Res Sq. 2024. PMID: 39070641 Free PMC article. Preprint.
-
DNA methylation reprogramming in medaka fish, a promising animal model for environmental epigenetics research.Environ Epigenet. 2020 Jul 7;6(1):dvaa008. doi: 10.1093/eep/dvaa008. eCollection 2020 Jan. Environ Epigenet. 2020. PMID: 32670620 Free PMC article.
-
Methylome profile of medaka eggs and sperm.Epigenetics. 2024 Dec;19(1):2417151. doi: 10.1080/15592294.2024.2417151. Epub 2024 Oct 21. Epigenetics. 2024. PMID: 39428969 Free PMC article.
-
Parental thermal environment controls the offspring phenotype in Brook charr (Salvelinus fontinalis): insights from a transcriptomic study.G3 (Bethesda). 2024 May 7;14(5):jkae051. doi: 10.1093/g3journal/jkae051. G3 (Bethesda). 2024. PMID: 38478598 Free PMC article.
-
Ancestral BPA exposure caused defects in the liver of medaka for four generations.Sci Total Environ. 2023 Jan 15;856(Pt 1):159067. doi: 10.1016/j.scitotenv.2022.159067. Epub 2022 Sep 26. Sci Total Environ. 2023. PMID: 36174697 Free PMC article.
References
-
- Kass SU, Pruss D, Wolffe AP.. How does DNA methylation repress transcription? Trends Genet. 1997;13(11):444–449. - PubMed
-
- Li E, Beard C, Jaenisch R.. Role for DNA methylation in genomic imprinting. Nature. 1993;366(6453):362. - PubMed
-
- Jähner D, Stuhlmann H, Stewart CL, et al. De novo methylation and expression of retroviral genomes during mouse embryogenesis. Nature. 1982;298(5875):623. - PubMed
-
- Iida A, Shimada A, Shima A, et al. Targeted reduction of the DNA methylation level with 5-azacytidine promotes excision of the medaka fish Tol2 transposable element. Genet Res (Camb). 2006;87(3):187–193. - PubMed
-
- Bestor TH. The DNA methyltransferases of mammals. Hum Mol Genet. 2000;9(16):2395–2402. - PubMed
Publication types
MeSH terms
Substances
Grants and funding
LinkOut - more resources
Full Text Sources
Other Literature Sources
Molecular Biology Databases