Development of a cytology-based multivariate analytical risk index for oral cancer
- PMID: 31010626
- PMCID: PMC7358989
- DOI: 10.1016/j.oraloncology.2019.02.011
Development of a cytology-based multivariate analytical risk index for oral cancer
Abstract
Objectives: The diagnosis and management of oral cavity cancers are often complicated by the uncertainty of which patients will undergo malignant transformation, obligating close surveillance over time. However, serial biopsies are undesirable, highly invasive, and subject to inherent issues with poor inter-pathologist agreement and unpredictability as a surrogate for malignant transformation and clinical outcomes. The goal of this study was to develop and evaluate a Multivariate Analytical Risk Index for Oral Cancer (MARIO) with potential to provide non-invasive, sensitive, and quantitative risk assessments for monitoring lesion progression.
Materials and methods: A series of predictive models were developed and validated using previously recorded single-cell data from oral cytology samples resulting in a "continuous risk score". Model development consisted of: (1) training base classification models for each diagnostic class pair, (2) pairwise coupling to obtain diagnostic class probabilities, and (3) a weighted aggregation resulting in a continuous MARIO.
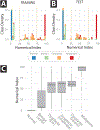
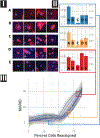
Results and conclusions: Diagnostic accuracy based on optimized cut-points for the test dataset ranged from 76.0% for Benign, to 82.4% for Dysplastic, 89.6% for Malignant, and 97.6% for Normal controls for an overall MARIO accuracy of 72.8%. Furthermore, a strong positive relationship with diagnostic severity was demonstrated (Pearson's coefficient = 0.805 for test dataset) as well as the ability of the MARIO to respond to subtle changes in cell composition. The development of a continuous MARIO for PMOL is presented, resulting in a sensitive, accurate, and non-invasive method with potential for enabling monitoring disease progression, recurrence, and the need for therapeutic intervention of these lesions.
Keywords: Cytology; Model ensembles; Multi-class classification; Oral cancer; Risk assessment.
Copyright © 2019. Published by Elsevier Ltd.
Figures


References
-
- Siegel RL, Miller KD, Jemal A. Cancer Statistics, 2017. CA Cancer J Clin. 2017;67:7–30. - PubMed
-
- Al-Dakkak I Oral dysplasia and risk of progression to cancer. Evid Based Dent. 2010;11:91–2. - PubMed
-
- Bosman FT Dysplasia classification: pathology in disgrace? J Pathol. 2001;194:143–4. - PubMed
-
- Warnakulasuriya S, Reibel J, Bouquot J, Dabelsteen E Oral epithelial dysplasia classification systems: predictive value, utility, weaknesses and scope for improvement. J Oral Pathol Med. 2008;37:127–33. - PubMed
-
- Granter SR, Beck AH, Papke DJ. AlphaGo, Deep Learning, and the Future of the Human Microscopist. Arch Pathol Lab Med. 2017;141:619–21. - PubMed
Publication types
MeSH terms
Grants and funding
LinkOut - more resources
Full Text Sources
Other Literature Sources
Medical

