. 2019 May 7;116(9):1701-1718.
doi: 10.1016/j.bpj.2019.03.023. Epub 2019 Apr 2.

An Inward-Rectifier Potassium Channel Coordinates the Properties of Biologically Derived Membranes

Affiliations

An Inward-Rectifier Potassium Channel Coordinates the Properties of Biologically Derived Membranes

Collin G Borcik et al. Biophys J. .

Abstract

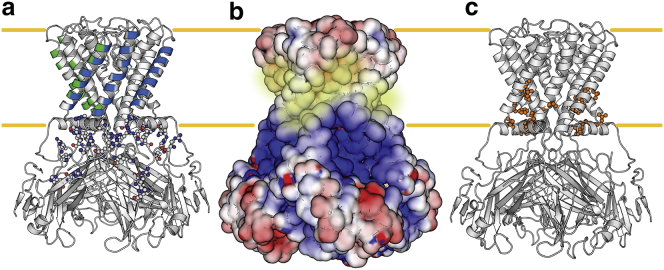
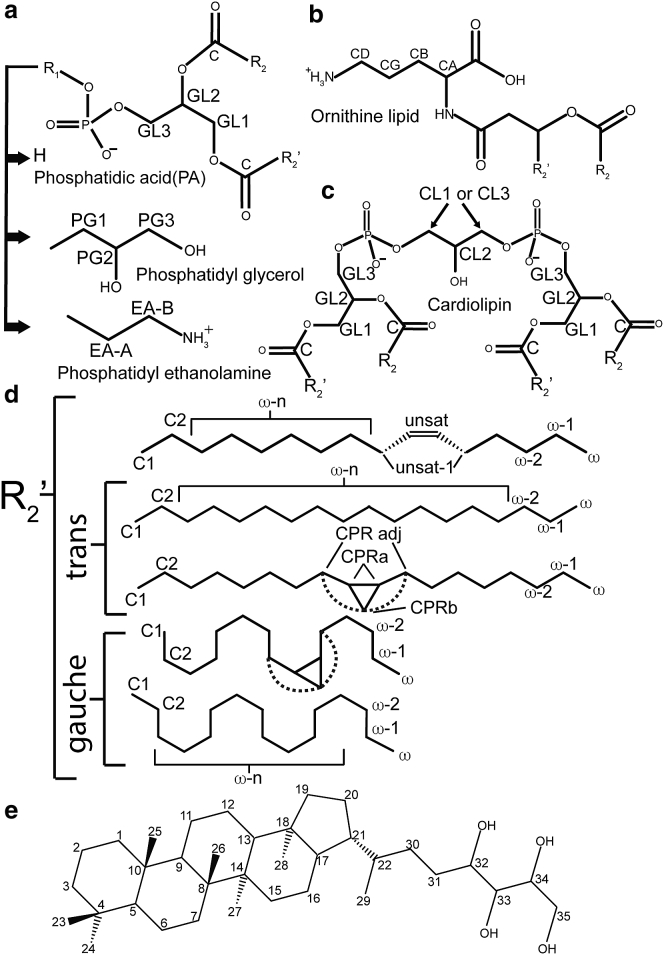
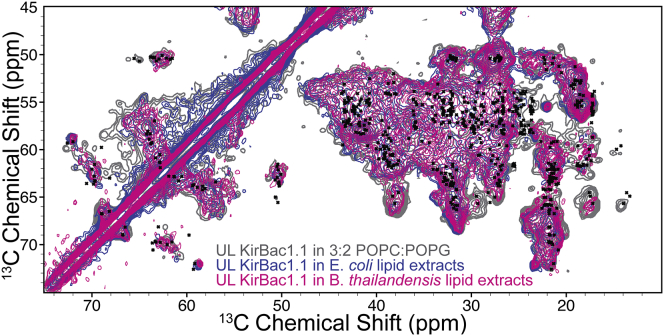
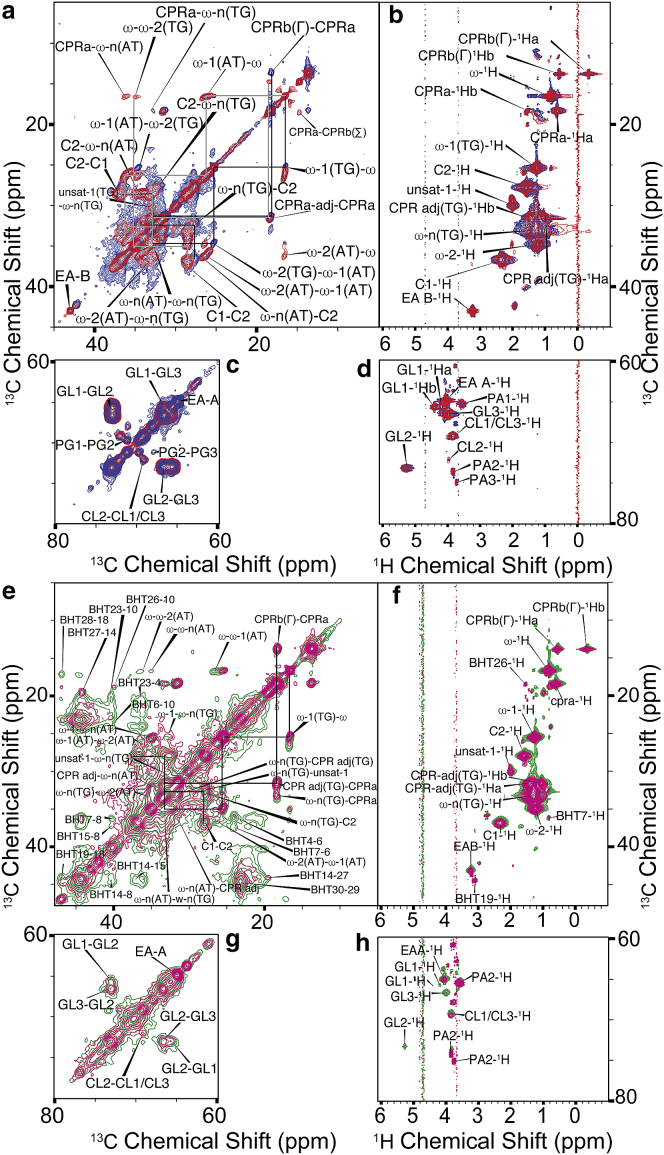
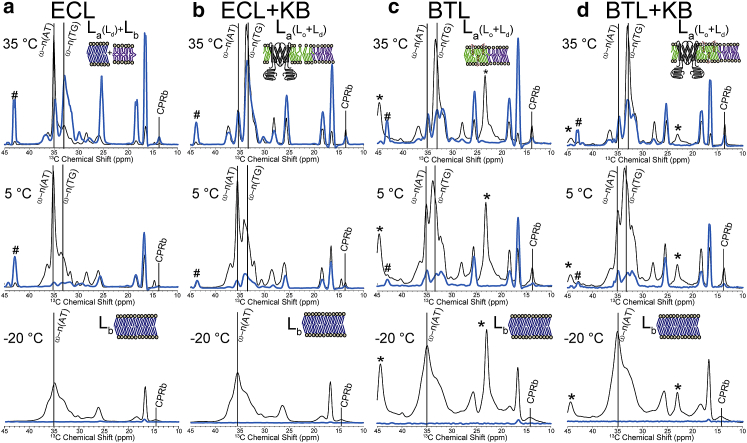
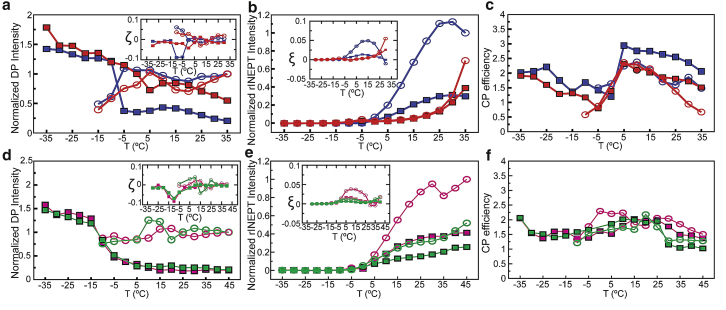
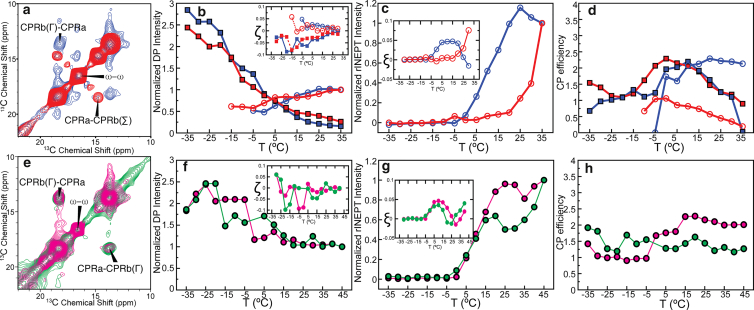
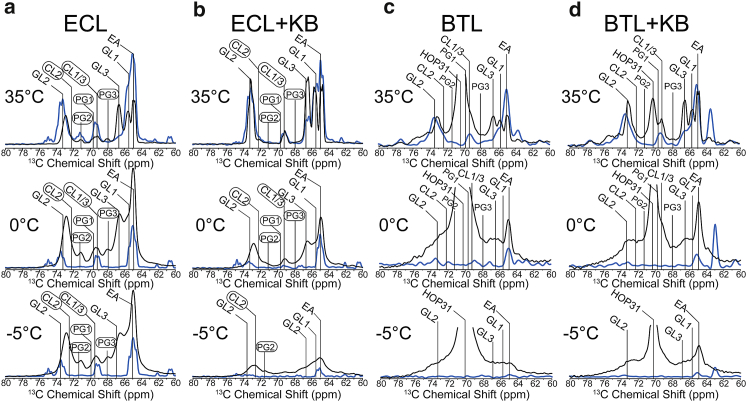
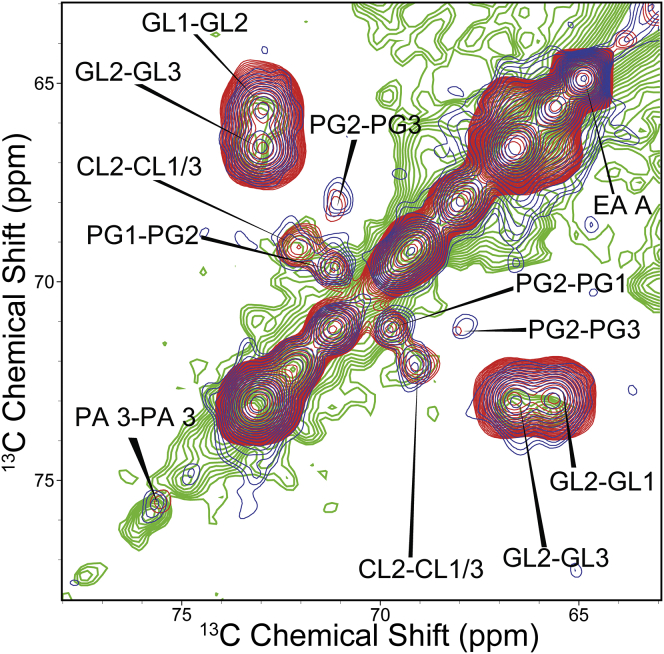
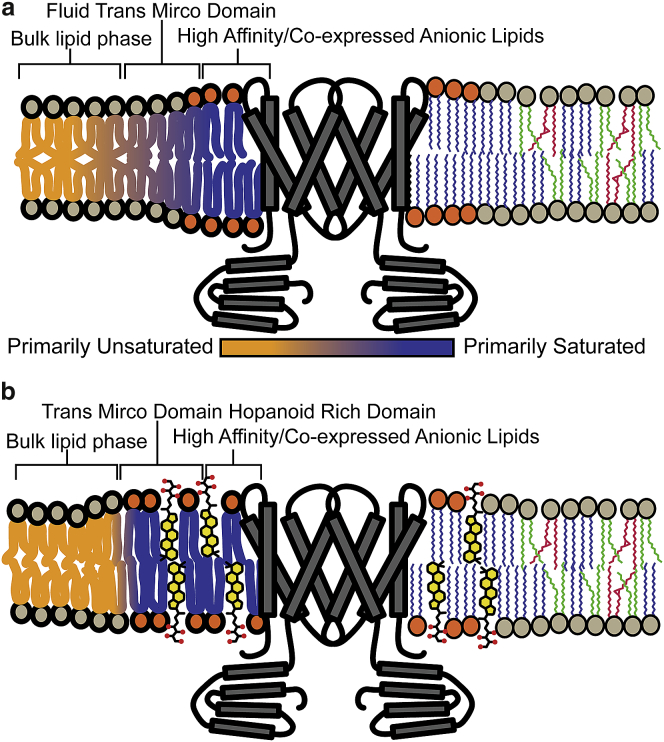
KirBac1.1 is a prokaryotic inward-rectifier K+ channel from Burkholderia pseudomallei. It shares the common inward-rectifier K+ channel fold with eukaryotic channels, including conserved lipid-binding pockets. Here, we show that KirBac1.1 changes the phase properties and dynamics of the surrounding bilayer. KirBac1.1 was reconstituted into vesicles composed of 13C-enriched biological lipids. Two-dimensional liquid-state and solid-state NMR experiments were used to assign lipid 1H and 13C chemical shifts as a function of lipid identity and conformational degrees of freedom. A solid-state NMR temperature series reveals that KirBac1.1 lowers the primary thermotropic phase transition of Escherichia coli lipid membranes while introducing both fluidity and internal lipid order into the fluid phases. In B. thailandensis liposomes, the bacteriohopanetetrol hopanoid, and potentially ornithine lipids, introduce a similar primary lipid-phase transition and liquid-ordered properties. Adding KirBac1.1 to B. thailandensis lipids increases B. thailandensis lipid fluidity while preserving internal lipid order. This synergistic effect of KirBac1.1 in bacteriohopanetetrol-rich membranes has implications for bilayer dynamic structure. If membrane proteins can anneal lipid translational degrees of freedom while preserving internal order, it could offer an explanation to the nature of liquid-ordered protein-lipid organization in vivo.


Figures

Figure 1
Figure 1
The structure of KirBac1.1 (Protein Data Bank [PDB]: 1p7b) with potential lipid-binding sites. The lipid bilayer is marked by yellow lines. (a) Transmembrane helices (blue and green) of KirBac1.1 form grooves on the protein surface that may act as binding pockets for saturated lipid acyl chains or polycyclic lipids, like cholesterol and hopanoids. The cytoplasmic region is rich in cationic side chains, depicted as balls and sticks. (b) Shown is the electrostatic surface of KirBac1.1 showing the positively charged region (blue) proximal to the lipid bilayer in which anionic lipids, such as phosphatidylglycerol (PG), phosphatidic acid (PA), and cardiolipin (CL), can bind. Potential acyl chain binding grooves are highlighted in yellow. (c) Shown are cholesterol binding motifs (orange) in the transmembrane helices of KirBac1.1 (53, 54, 55, 56). To see this figure in color, go online.
Figure 2
Figure 2
Lipids and conformations identified in E. coli and B. thailandensis lipid extracts. (a) Shown are phosphatidic acid (PA), phosphatidylglycerol (PG), and phosphatidylethanolamine (PE) lipid headgroups, (b) ornithine lipid headgroups, (c) cardiolipin (CL) headgroup, (d) and saturated, unsaturated, and cyclopropyl lipid side chains. trans and gauche conformations are depicted. (e) BHT hopanoid and numbering convention is used in this text.
Figure 3
Figure 3
Predicted chemical shifts closely matches experimental 2D 13C-13C DARR spectra in various bilayer compositions. Shown is an overlay of U-15N,13C KirBac1.1 in natural abundance (NA)3:2 POPC:POPG (gray), U-15N,13C KirBac1.1 in NA E. coli lipid extracts (blue), and U-15N,13C KirBac1.1 in NA B. thailandensis lipid extracts (magenta). Black dots are predicted chemical shifts calculated from the crystal structure of KirBac1.1 by SHIFTX2. To see this figure in color, go online.
Figure 4
Figure 4
SSNMR 2D spectra. Shown are the expanded regions of solid-state 2D 13C-13C DARR (a, c, e, and g) and 1H-13C HMQC (b, d, f, and h) spectra of densely occupied regions of ECL (red), ECL + KB (blue), BTL (green), and BTL + KB (magenta). Black and gray lines are to assist in following the assignments down the acyl chain and where the chemical shifts diverge for the cyclopropane ring and unsaturated acyl chains. Black lines show the connectivity for the trans-gauche (TG) peaks, and gray lines show the all-trans (AT) connectivity. Assignments are listed in Table S3 and S4. Full spectra are provided in Fig. S11. To see this figure in color, go online.
Figure 5
Figure 5
Snapshots of the SSNMR temperature series for ECL, ECL + KB, BTL, and BTL + KB samples. Cross-polarization (CP) spectra are in black, and refocused INEPT (rINEPT) are in blue. Temperature series are as follows: (a) ECL, (b) ECL + KB, (c) BTL, and (d) BTL + KB. Ethanolamine headgroups are denoted with a pound symbol, and hopanoid headgroups are marked with an asterisk. Our hypothesized starting (−20°C) and ending (35°C) lipid phases for each temperature series are inserted. (The complete temperature series is provided in Figs. S4 and S5). To see this figure in color, go online.
Figure 6
Figure 6
Integrated peak intensities of AT and TG peaks observed in DP, rINEPT, and CP spectra. In (ac), the ECL AT conformer peak intensities are denoted as solid red squares, and TG peak intensity is denoted by open red circles. The ECL + KB AT peak are indicated as solid blue squares, and the TG peak is denoted by open blue circles. In (df), the BTL AT conformer peak intensity is denoted as solid green squares, and TG conformer peak intensities are denoted as open green circles. The BTL + KB AT peak is indicated as solid magenta squares, and the TG peak is indicated by open magenta circles. Insets in (a), (b), (d), and (e) represent the first derivatives of the DP and rINEPT curves, respectively, with ζ plotting the rate of change of the TG and AT populations, and ξ illustrating the rate of rINEPT signal increase with temperature, which may be related to heterogeneity or second-order phase transitions within the liquid-crystalline lipid phase. The error is within the size of the symbol in the graph. To see this figure in color, go online.
Figure 7
Figure 7
KirBac1.1 changes the dynamic states of the cyclopropane ring. (a) DARR spectra containing the CPR chemical shifts of ECL (red) and ECL + KB (blue) samples are shown. In (bd), the ECL trans CPRb-Σ conformer peak intensities are denoted as solid red squares, and gauche CPRb-Γ peak intensity is denoted by open red circles. The ECL + KB CPRb-Σ peak is indicated as solid blue squares, and the CPRb-Γ peak is denoted by open blue circles. (e) DARR spectra containing the cyclopropane chemical shifts of BTL (green) and BTL + KB (magenta) samples are shown. In (fh), the BTL CPRb-Γ conformer peak intensities are denoted as solid green circles. The BTL + KB CPRb-Γ conformer peak intensities are denoted as solid magenta circles. Insets in (b), (c), (f), and (g) represent the first derivatives of the DP and rINEPT curves, respectively, with ζ plotting the rate of change of the CPRb-Γ and CPRb-Σ populations, and ξ defining the rate of rINEPT signal increase with temperature, which may be related to heterogeneity or second-order phase transitions within the liquid-crystalline lipid phase. The error is within the size of the symbol in the graph. To see this figure in color, go online.
Figure 8
Figure 8
Headgroup and glycerol backbone region of the CP (black) and rINEPT (blue) spectra vary drastically depending on sample temperature. (a) Shown are ECL headgroups and glycerol backbone region with resonances assigned and anionic headgroups circled. (b) Shown are ECL + KB headgroups and glycerol backbone region with resonances assigned and anionic headgroups circled. (c) Shown are BTL headgroups and glycerol backbone region with resonances assigned. (d) Shown are BTL + KB headgroups and glycerol backbone region with resonances assigned and anionic headgroups circled. To see this figure in color, go online.
Figure 9
Figure 9
Anionic lipid headgroup chemical shifts are found in the 13C-13C 2D spectra of uniformly labeled 13C KirBac1.1. Red denotes ECL; blue denotes ECL + KB; and green denotes U-15N,13C-KirBac1.1 in natural abundance 3:1 POPC:POPG. Anionic lipid species can be seen to have survived the detergent solubilization during KirBac1.1 purification and appear in the 13C-13C 2D DARR spectra. Crosspeaks present in the DARR spectra of the U-15N,13C-KirBac1.1 sample are the glycerol backbone crosspeaks: GL2-GL3 and GL2-GL1; cardiolipin crosspeaks are CL2-CL1/3; and phosphatidyl glycerol (PG) peaks are PG2- PG1. To see this figure in color, go online.
Figure 10
Figure 10
The proposed gradient lipid saturation model for the organization of E. coli and B. thailandensis lipids relative to KirBac1.1 in the bilayer. (a) Left illustrates the gradient saturation model in ECL + KB, and right shows the hypothesized average positions of the saturated (blue), unsaturated (green), and CPR (red) lipids. (b) Left shows the location of BHT within our proposed gradient lipid saturation bilayer model, and right shows the hypothesized average positions of the saturated (blue), unsaturated (green), and CPR (red) with hopanoids (yellow). To see this figure in color, go online.

Similar articles

Cited by

References

    1. Brown D.A., London E. Structure of detergent-resistant membrane domains: does phase separation occur in biological membranes? Biochem. Biophys. Res. Commun. 1997;240:1–7. - PubMed
    1. Brown D.A., London E. Functions of lipid rafts in biological membranes. Annu. Rev. Cell Dev. Biol. 1998;14:111–136. - PubMed
    1. Simons K., Vaz W.L. Model systems, lipid rafts, and cell membranes. Annu. Rev. Biophys. Biomol. Struct. 2004;33:269–295. - PubMed
    1. Lee A.G. Lipid-protein interactions in biological membranes: a structural perspective. Biochim. Biophys. Acta. 2003;1612:1–40. - PubMed
    1. Brown M.F. Soft matter in lipid-protein interactions. Annu. Rev. Biophys. 2017;46:379–410. - PubMed

Publication types

MeSH terms

LinkOut - more resources