. 2019 Jun 1;202(11):3226-3233.
doi: 10.4049/jimmunol.1900191. Epub 2019 Apr 22.

Measuring Thymic Clonal Deletion at the Population Level

Affiliations

Measuring Thymic Clonal Deletion at the Population Level

Elise R Breed et al. J Immunol. .

Abstract

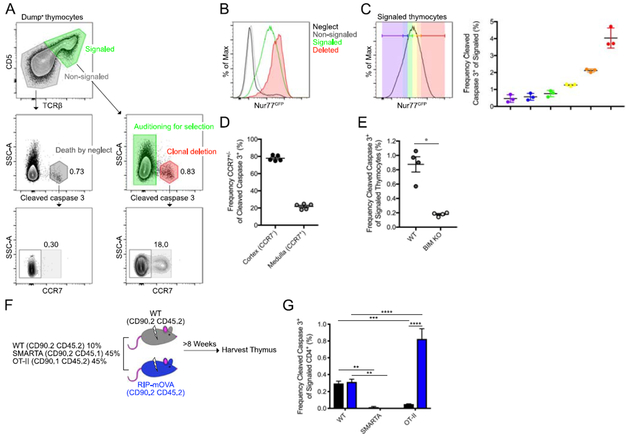
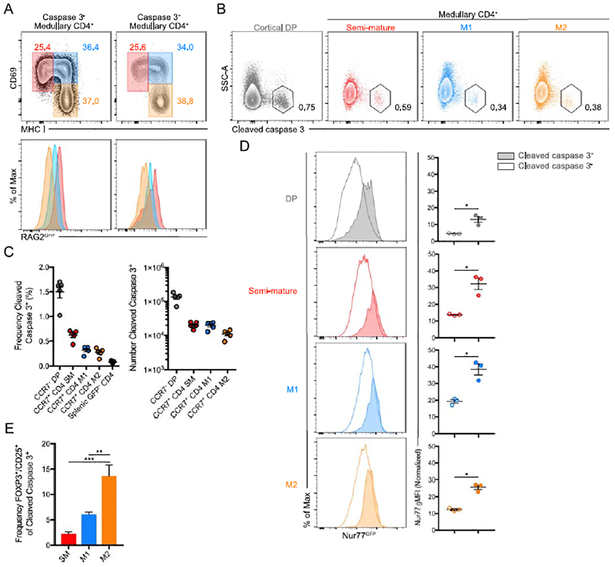
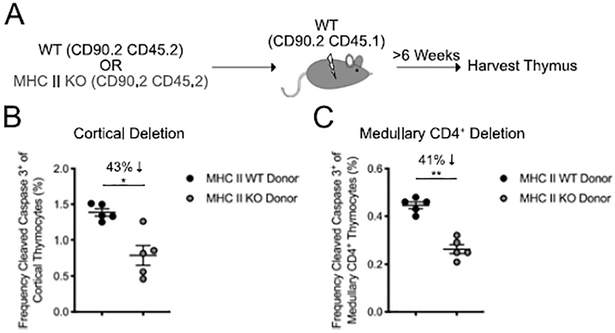
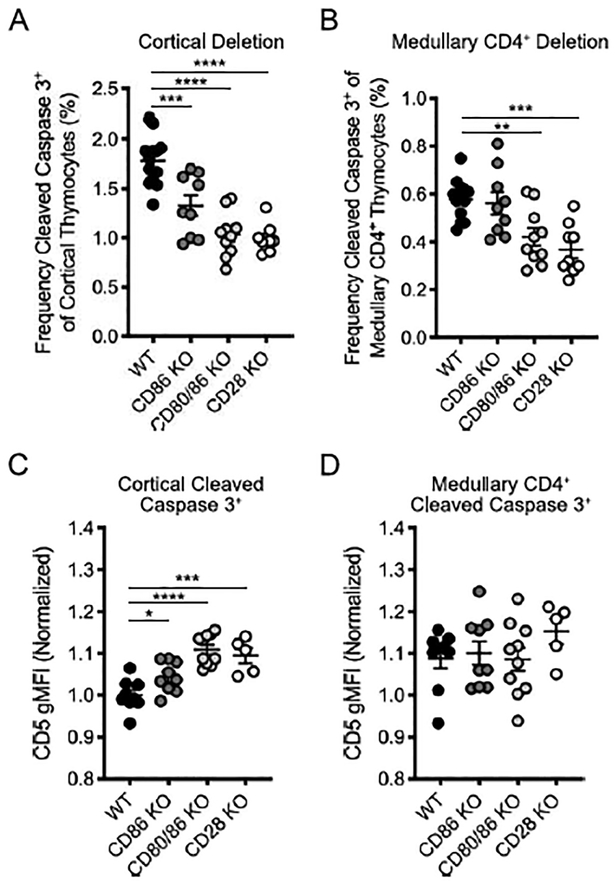
Clonal deletion of T cells specific for self-antigens in the thymus has been widely studied, primarily by approaches that focus on a single receptor (using TCR transgenes) or a single specificity (using peptide-MHC tetramers). However, less is known about clonal deletion at the population level. In this article, we report an assay that measures cleaved caspase 3 to define clonal deletion at the population level. This assay distinguishes clonal deletion from apoptotic events caused by neglect and approximates the anatomic site of deletion using CCR7. This approach showed that 78% of clonal deletion events occur in the cortex in mice. Medullary deletion events were detected at both the semimature and mature stages, although mature events were associated with failed regulatory T cell induction. Using this assay, we showed that bone marrow-derived APC drive approximately half of deletion events at both stages. We also found that both cortical and medullary deletion rely heavily on CD28 costimulation. These findings demonstrate a useful strategy for studying clonal deletion within the polyclonal repertoire.


Conflict of interest statement

Disclosures

The authors have no financial conflicts of interest.

Figures

Figure 1.
Figure 1.. Cleaved caspase 3 distinguishes thymocytes undergoing clonal deletion.
(A) Flow cytometry gating strategy for the identification of cells undergoing clonal deletion or death by neglect in the thymus. Signaled and non-signaled thymocytes identified by the expression of CD5 and TCRβ, excluding CD25+, NK1.1+, CD19+, and TCRγδ+ (Dump) cells (top). Clonal deletion and death by neglect identified by the expression of cleaved caspase 3 (middle) and approximate anatomic location identified by CCR7 (bottom). Numbers adjacent to outlined areas indicate percent cells in each. (B) Flow cytometry from Nur77GFP mice showing GFP expression by CD5TCRβcleaved caspase 3+ (neglect) CD5TCRβ (non-signaled), CD5+TCRβ+ (signaled), and CD5+TCRβ+cleaved caspase 3+ (deletion) (as demonstrated in A). (C) Flow cytometry from Nur77GFP mice showing gating based on GFP expression (approximately 15% of total CD5+TCRβ+ cells per gate) (left) and frequency of cleaved caspase 3 expression among CD5+TCRβ+ (signaled) thymocytes in each gate (right). (D) Frequency of CCR7 or CCR7+ among clonally deleted cells (as shown in A). (E) Frequency of cleaved caspase 3+ cells among CD5+TCRβ+ thymocytes (as gated in A) from BIM WT or BIM KO littermates. (F) Experimental design used to generate bone marrow chimeric mice. (G) Frequency of cleaved caspase 3+ cells among CD5+TCRβ+ (signaled) thymocytes (as gated in A) from bone marrow chimeric mice (as in F). Each symbol (C, D, E) represents an individual mouse. Six- to twelve-week-old male and female mice were used. Small horizontal lines indicate the mean and error bars represent SEM. *P< 0.05, **P< 0.01, ***P< 0.001, ****P< 0.0001. Statistical significance was determined by Mann-Whitney test (E) or 2way Anova with Dunnett’s and Sidak’s multiple comparisons tests (G). Data are representative of more than ten experiments (A, B, C, D) or are pooled from two (E, G) independent experiments with at least three mice per group.
Figure 2.
Figure 2.. Mature thymocytes are susceptible to clonal deletion.
(A) Flow cytometry of total or deleted CD5+TCRβ+ medullary (CCR7+) CD4+ thymocytes from Rag2GFP mice (gated as in Figure 1A). Gates of three subsets of medullary thymocytes based on expression of CD69 and MHC I (top), and GFP expression by CD69+MHC I (SM), CD69+MHC I+ (M1), and CD69MHC I+ (M2) cells (bottom). Numbers adjacent to outlined areas indicate percent cells in each. (B) Flow cytometry of deleted thymocytes (as gated in Figure 1A) of cortical (CCR7) DP or medullary (CCR7+) CD4+ subsets. Numbers adjacent to outlined areas indicate percent cleaved caspase 3+ cells in each. (C) Frequency (left) and numbers (right) of cleaved caspase 3+ thymocytes among CD5+TCRβ+ thymocyte subsets or CD4+ splenocytes from Rag2GFP mice (gated as in Figure 1A). (D) Flow cytometry of deleted or non-deleted thymocytes (as gated in Figure 1A) from Nur77GFP mice (left) and geometric mean fluorescence intensity (gMFI) normalized to controls (right). (E) Frequency of CD25+ or FOXP3+ among CD5+TCRβ+CD4+cleaved caspase 3+ thymocytes negatively enriched for CD4 using MACS purification from bone marrow chimeric mice that received FOXP3GFP bone marrow. Data are representative of more than 5 independent experiments (A, B, C, D) or 2 independent experiments (E). Each symbol (C, D) represents an individual mouse. Six- to twelve-week-old male and female mice were used. Small horizontal lines indicate the mean and error bars represent SEM. *P< 0.05, **P< 0.01, ***P< 0.001. Statistical significance was determined by one-tailed Mann-Whitney test (D) or ordinary one-way ANOVA with Tukey multiple comparisons test (E).
Figure 3.
Figure 3.. Bone marrow derived APC contribute to approximately half of clonal deletion events.
(A) Experimental strategy for generating bone marrow chimeric mice. (B) Frequency of cleaved caspase 3+ thymocytes among CD5+TCRβ+ cortical (CCR7) thymocytes (as gated in Figure 1A). (C) Frequency of cleaved caspase 3+ thymocytes among CD5+TCRβ+ medullary (CCR7+) CD4+ thymocytes (as gated in Figure 1A). Each symbol (B, C) represents an individual mouse. Six- to twelve-week-old female mice were used. Small horizontal lines indicate the mean and error bars represent SEM. *P< 0.05, **P< 0.01. Statistical significance was determined by Mann-Whitney test (B, C). Data are pooled from two independent experiments.
Figure 4.
Figure 4.. Co-stimulatory molecules CD80 and CD86 are required for both cortical and medullary clonal deletion.
(A) Frequency of cleaved caspase 3+ cells among CD5+TCRβ+ cortical (CCR7) thymocytes (as gated in Figure 1A) in WT, CD86 KO, CD80/86 KO, and CD28 KO mice. (B) Frequency of cleaved caspase 3+ cells among CD5+TCRβ+ medullary (CCR7+) CD4+ thymocytes (as gated in Figure 1A). (C) CD5 gMFI of cortical deleted thymocytes (normalized to mean of WT CD5 gMFI) (from A). (D) CD5 gMFI of medullary deleted CD4+ thymocytes (normalized to mean of WT CD5 gMFI) (from B). Each symbol (A, B, C, D) represents an individual mouse. Six- to twelve-week-old male and female mice were used. Small horizontal lines indicate the mean and error bars represent SEM. *P< 0.05, **P< 0.01, ***P< 0.001, ****P< 0.0001. Statistical significance was determined by ordinary one-way ANOVA with Holm-Sidak’s multiple comparisons test (A, B, C, D). Data are pooled from at least three independent experiments (A, B, C, D).
Figure 5.
Figure 5.. CD80 and CD86 are localized in both the thymus cortex and medulla.
(A) Immunofluorescence microscopy (top) of thymic sections from C57BL/6 mice stained for CD80 (green), and CD86 (red). White dashed lines indicate cortical-medullary border based on UEA I staining (not shown). C, cortex; M, medulla. Scale bars 100μm. Analysis of images by histo-cytometry (bottom, left). Dots represent localization of each stain as determined by histo-cytometry. Frequencies of CD80+ and CD86+ cells identified as localized in the cortex by histo-cytometry (bottom, right). Numbers indicate percent cells in each outlined area. (B) Immunofluorescence microscopy (top) of thymic sections from C57BL/6 mice stained for CD11c (green), and CD86 (red). White dashed lines indicate cortical-medullary border based on UEA I staining (not shown). C, cortex; M, medulla. Scale bars 100μm. Analysis of images by histo-cytometry (bottom, left). Dots represent localization of each stain as determined by histo-cytometry. Frequency of CD86+ cells among CD11c+ cells identified as localized in the cortex by histo-cytometry (bottom, right). Number indicates percent cells in gated area. (C) Immunofluorescence microscopy (top) of thymic sections from C57BL/6 mice stained for F4/80 (green), and CD86 (red). White dashed lines indicate cortical-medullary border based on UEA I staining (not shown). C, cortex; M, medulla. Scale bars 100μm. Analysis of images by histo-cytometry (bottom, left). Dots represent localization of each stain as determined by histo-cytometry. Frequency of CD86+ cells among F4/80+ cells identified as localized in the cortex by histo-cytometry (bottom, right). Number indicates percent cells in gated area. Six- to twelve-week-old male and female mice were used. Data are representative of at least three independent experiments.

References

    1. Klein L, Kyewski B, Allen PM, and Hogquist KA. 2014. Positive and negative selection of the T cell repertoire: what thymocytes see (and don’t see). Nat Rev Immunol 14: 377–391. - PMC - PubMed
    1. McCaughtry TM, Baldwin TA, Wilken MS, and Hogquist KA. 2008. Clonal deletion of thymocytes can occur in the cortex with no involvement of the medulla. J Exp Med 205: 2575–2584. - PMC - PubMed
    1. Stritesky GL, Xing Y, Erickson JR, Kalekar LA, Wang X, Mueller DL, Jameson SC, and Hogquist KA. 2013. Murine thymic selection quantified using a unique method to capture deleted T cells. Proc Natl Acad Sci U S A 110: 4679–4684. - PMC - PubMed
    1. McDonald BD, Bunker JJ, Erickson SA, Oh-Hora M, and Bendelac A. 2015. Crossreactive αβ T Cell Receptors Are the Predominant Targets of Thymocyte Negative Selection. Immunity. - PMC - PubMed
    1. Marzo AL, Klonowski KD, Le Bon A, Borrow P, Tough DF, and Lefrançois L. 2005. Initial T cell frequency dictates memory CD8+ T cell lineage commitment. Nat. Immunol. 6: 793–9. - PMC - PubMed

Publication types