. 2019 Jul;25(7):857-868.
doi: 10.1261/rna.070052.118. Epub 2019 Apr 22.

Ancestry patterns inferred from massive RNA-seq data

Affiliations

Ancestry patterns inferred from massive RNA-seq data

Ruth Barral-Arca et al. RNA. 2019 Jul.

Abstract

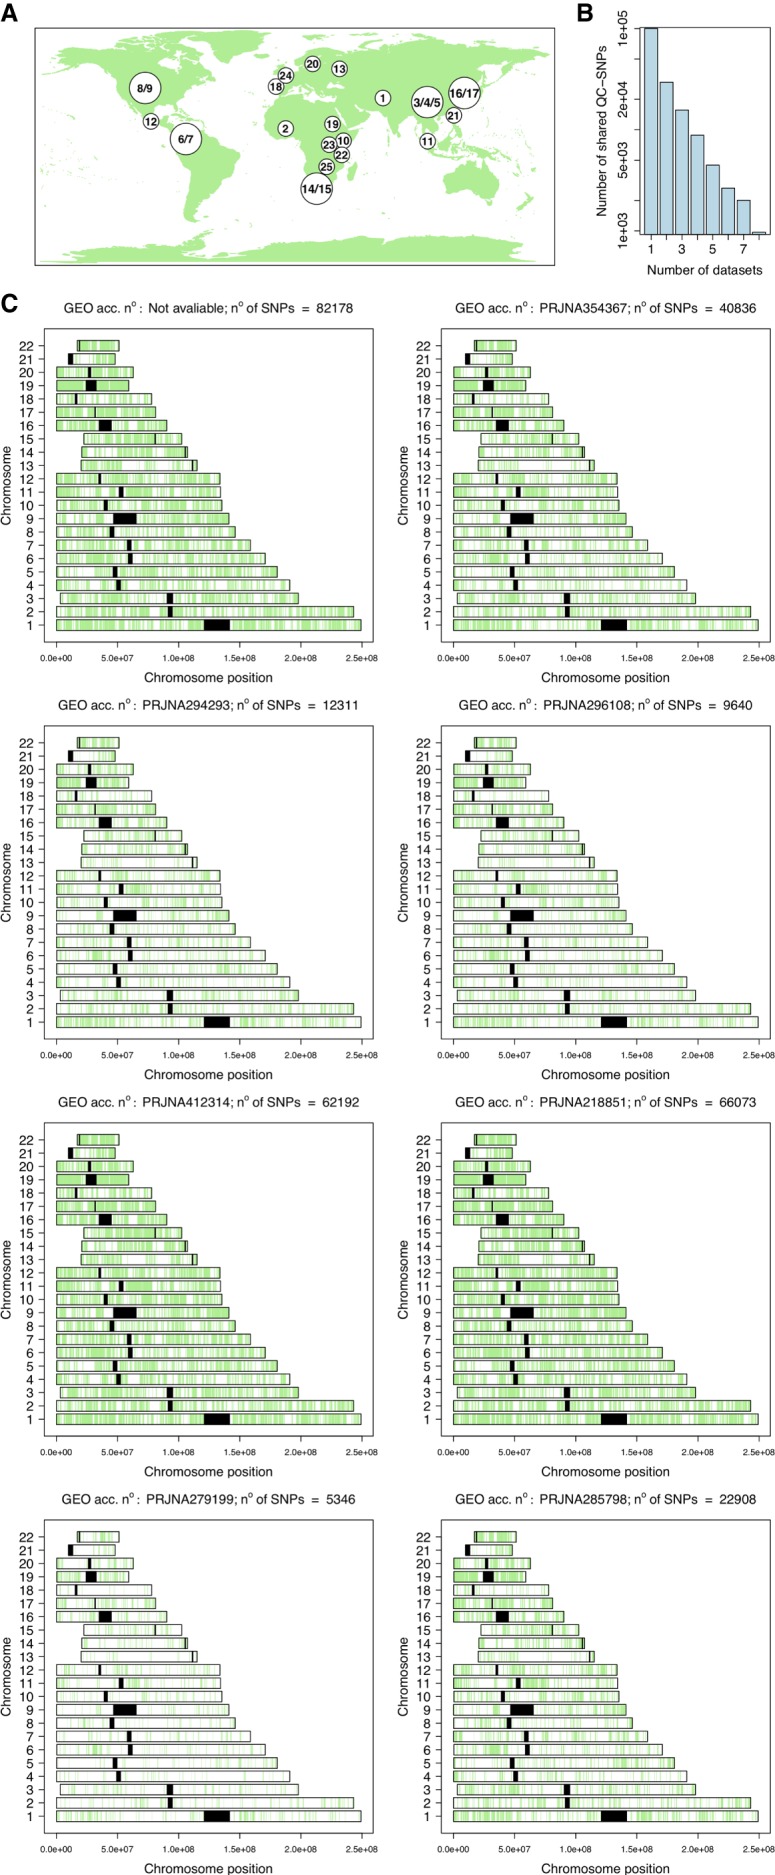
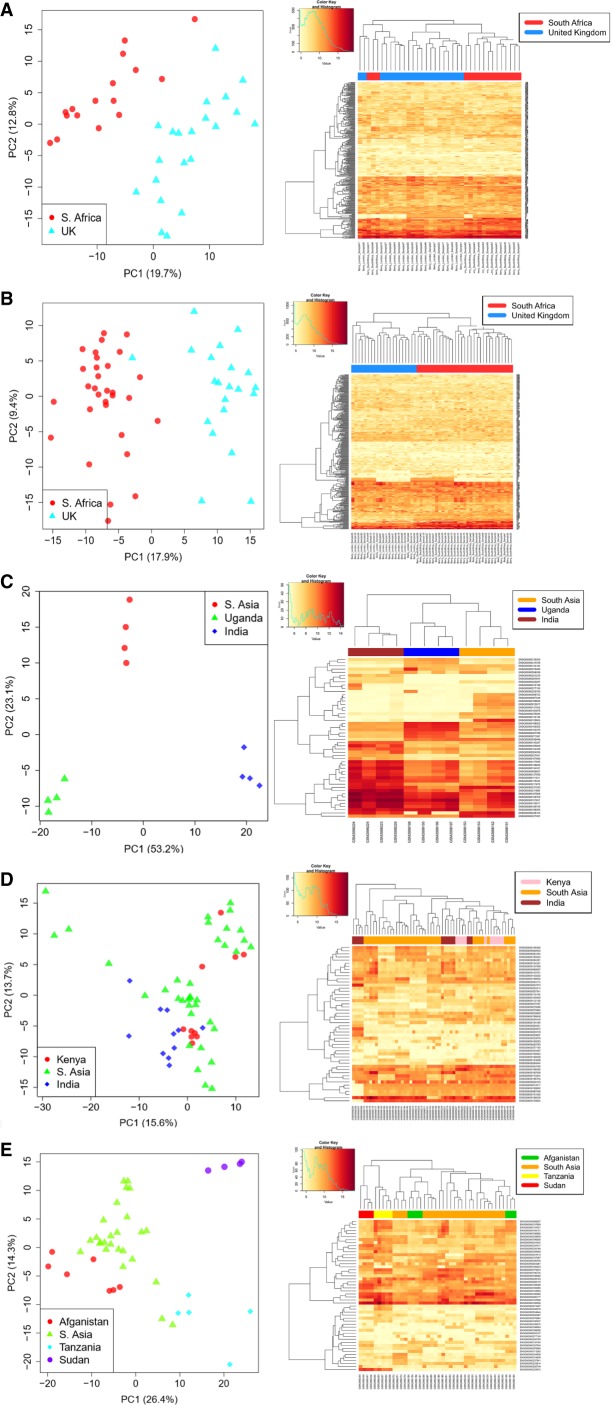
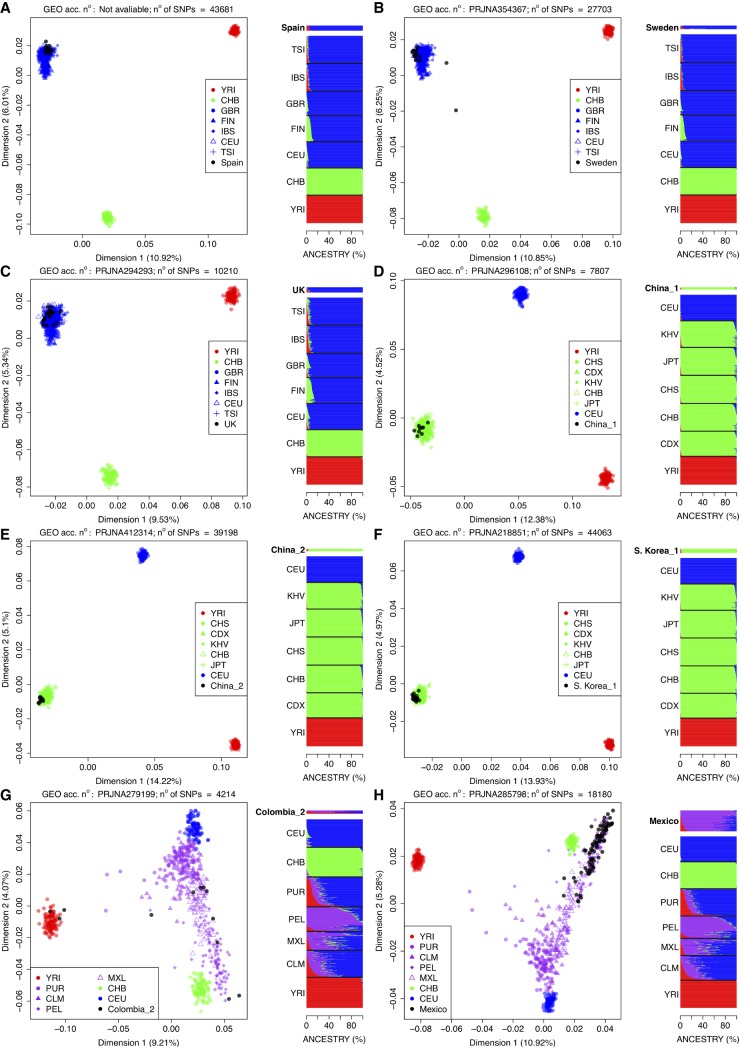
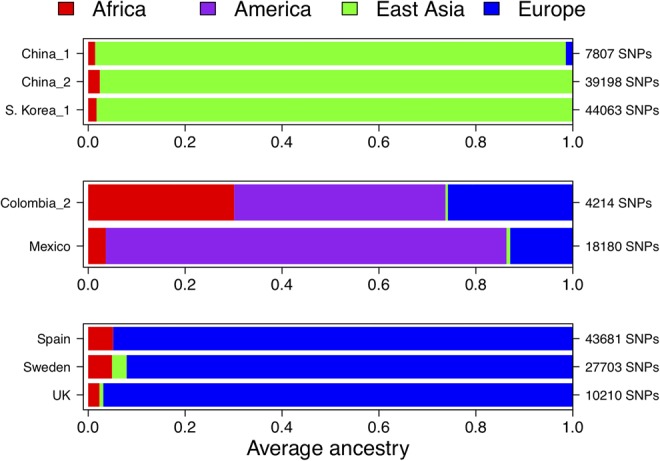
There is a growing body of evidence suggesting that patterns of gene expression vary within and between human populations. However, the impact of this variation in human diseases has been poorly explored, in part owing to the lack of a standardized protocol to estimate biogeographical ancestry from gene expression studies. Here we examine several studies that provide new solid evidence indicating that the ancestral background of individuals impacts gene expression patterns. Next, we test a procedure to infer genetic ancestry from RNA-seq data in 25 data sets where information on ethnicity was reported. Genome data of reference continental populations retrieved from The 1000 Genomes Project were used for comparisons. Remarkably, only eight out of 25 data sets passed FastQC default filters. We demonstrate that, for these eight population sets, the ancestral background of donors could be inferred very efficiently, even in data sets including samples with complex patterns of admixture (e.g., American-admixed populations). For most of the gene expression data sets of suboptimal quality, ancestral inference yielded odd patterns. The present study thus brings a cautionary note for gene expression studies highlighting the importance to control for the potential confounding effect of ancestral genetic background.

Keywords: RNA-seq; SNPs; biogeographical ancestry; gene expression; genomics; transcriptomics.


Figures

FIGURE 1.
FIGURE 1.
Gene expression data sets explored in the present study for the inference of ancestry. (A) The map shows the geographic location of the 25 RNA-seq data sets that were initially recruited from GEO; the correspondence between these ID codes and the GEO accession numbers, and the characteristics of the data sets are provided in Supplemental Table S1. (B) Only eight out of these 25 data sets passed all the quality filters, and these were used for the subsequent studies. The histogram shows the number of shared SNPs (the final set after applying all the filters) between data sets (see Supplemental Table S1 for more information). (C) Distribution of SNPs in chromosomes for the eight data sets used to infer the ancestry of donors (their GEO ID code is indicated; Supplemental Table S1).
FIGURE 2.
FIGURE 2.
Analysis of gene expression patterns in two case studies where information on ethnicity was available, indicating that ethnicity status per se impacts gene expression patterns. For each study, we show a PCA plot (right) built with the most highly expressed genes between ethnic groups and using the Deseq function “plotPCA,” while the heatmaps were built using a minimum subset of the most highly expressed genes (including all is not possible because of space limitations) that allowed to visualize different patterns between population sets (left): (A) Active TB from Berry et al. (2010), (B) latent TB from Berry et al. (2010), (C) control female group from Singhania et al. (2018), (D) control male group from Singhania et al. (2018), and (E) male TB cases from Singhania et al. (2018).
FIGURE 3.
FIGURE 3.
MDS plots and ancestry analysis for each of the eight data sets that overcome all the quality filters; their GEO ID numbers are indicated on top of each MDS analysis together with the number of SNPs involved in each analysis. In the admixture barplots (right) the label of the test population is bolded and their ancestral memberships barplots slightly separated from the barplots of the reference continental populations (from 1000G). (A) Spain; (B) Sweden (GEO acc. no: PRJNA354367); (C) UK (GEO acc. no: PRJNA294293); (D) China_1 (GEO acc. no: PRJNA296108); (E) China_2 (GEO acc. no: PRJNA412314); (F) Korea_1 (GEO acc. no: PRJNA218851); (G) Colombia_2 (GEO acc. no: PRJNA279199); and (H) Mexico (GEO acc. no: PRJNA285798).
FIGURE 4.
FIGURE 4.
Summary of ancestral memberships for the eight data sets explored in the present study.
FIGURE 5.
FIGURE 5.
Bioinformatic procedure to infer ancestry using RNA-seq data.

References

    1. Alexander DH, Novembre J, Lange K. 2009. Fast model-based estimation of ancestry in unrelated individuals. Genome Res 19: 1655–1664. 10.1101/gr.094052.109 - DOI - PMC - PubMed
    1. Aung T, Ozaki M, Lee MC, Schlötzer-Schrehardt U, Thorleifsson G, Mizoguchi T, Igo RP Jr, Haripriya A, Williams SE, Astakhov YS, et al. 2017. Genetic association study of exfoliation syndrome identifies a protective rare variant at LOXL1 and five new susceptibility loci. Nat Genet 49: 993–1004. 10.1038/ng.3875 - DOI - PMC - PubMed
    1. Barral-Arca R, Pardo-Seco J, Martinón-Torres F, Salas A. 2018. A 2-transcript host cell signature distinguishes viral from bacterial diarrhea and it is influenced by the severity of symptoms. Sci Rep 8: 8043 10.1038/s41598-018-26239-1 - DOI - PMC - PubMed
    1. Berry MP, Graham CM, McNab FW, Xu Z, Bloch SA, Oni T, Wilkinson KA, Banchereau R, Skinner J, Wilkinson RJ, et al. 2010. An interferon-inducible neutrophil-driven blood transcriptional signature in human tuberculosis. Nature 466: 973–977. 10.1038/nature09247 - DOI - PMC - PubMed
    1. Brown J, Pirrung M, McCue LA. 2017. FQC Dashboard: integrates FastQC results into a web-based, interactive, and extensible FASTQ quality control tool. Bioinformatics 33: 3137–3139. 10.1093/bioinformatics/btx373 - DOI - PMC - PubMed

Publication types

Substances

LinkOut - more resources