. 2019 May 14;116(20):9808-9813.
doi: 10.1073/pnas.1816020116. Epub 2019 Apr 22.

Global warming has increased global economic inequality

Affiliations

Global warming has increased global economic inequality

Noah S Diffenbaugh et al. Proc Natl Acad Sci U S A. .

Abstract

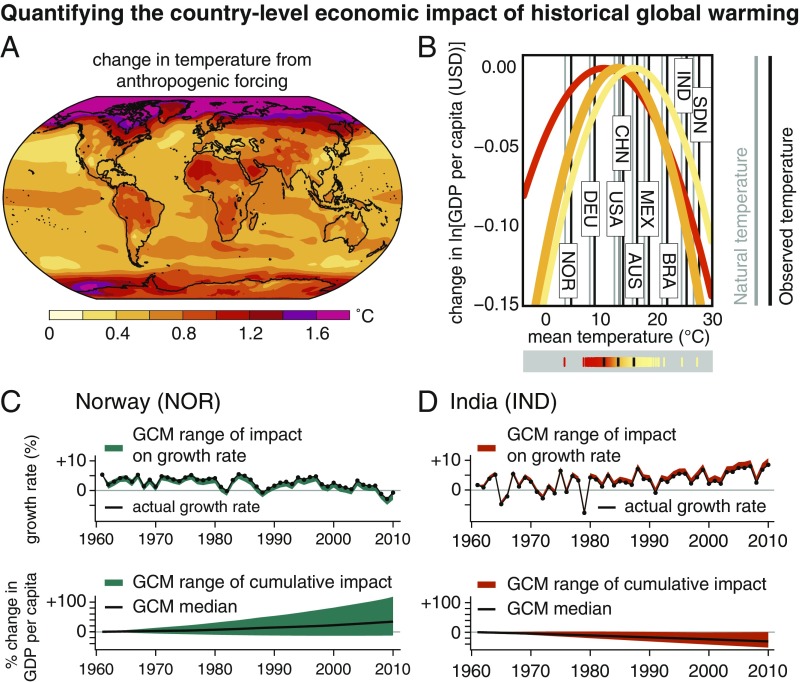
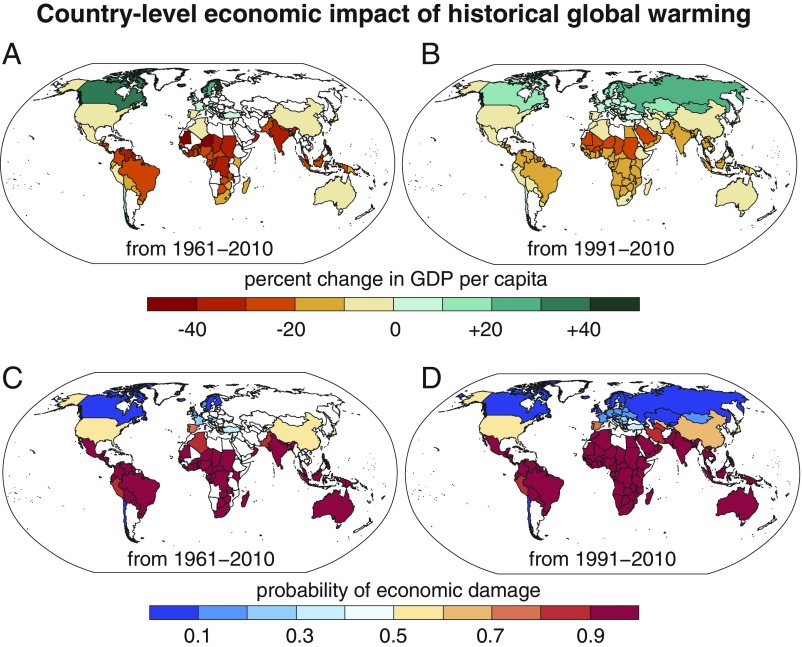
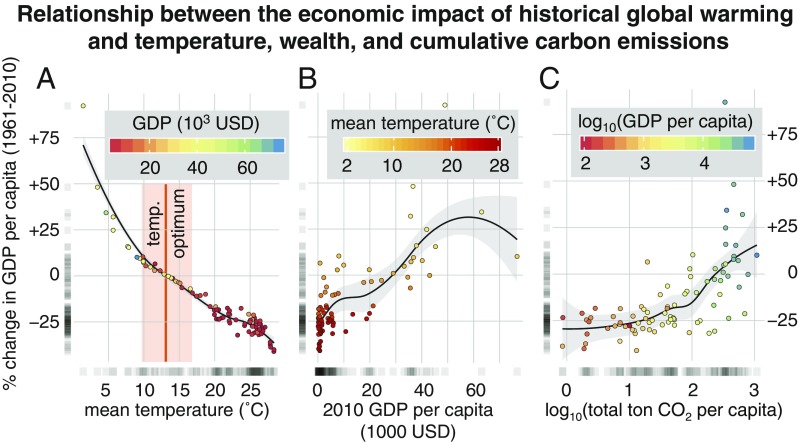
Understanding the causes of economic inequality is critical for achieving equitable economic development. To investigate whether global warming has affected the recent evolution of inequality, we combine counterfactual historical temperature trajectories from a suite of global climate models with extensively replicated empirical evidence of the relationship between historical temperature fluctuations and economic growth. Together, these allow us to generate probabilistic country-level estimates of the influence of anthropogenic climate forcing on historical economic output. We find very high likelihood that anthropogenic climate forcing has increased economic inequality between countries. For example, per capita gross domestic product (GDP) has been reduced 17-31% at the poorest four deciles of the population-weighted country-level per capita GDP distribution, yielding a ratio between the top and bottom deciles that is 25% larger than in a world without global warming. As a result, although between-country inequality has decreased over the past half century, there is ∼90% likelihood that global warming has slowed that decrease. The primary driver is the parabolic relationship between temperature and economic growth, with warming increasing growth in cool countries and decreasing growth in warm countries. Although there is uncertainty in whether historical warming has benefited some temperate, rich countries, for most poor countries there is >90% likelihood that per capita GDP is lower today than if global warming had not occurred. Thus, our results show that, in addition to not sharing equally in the direct benefits of fossil fuel use, many poor countries have been significantly harmed by the warming arising from wealthy countries' energy consumption.

Keywords: CMIP5; climate change attribution; economic inequality; global warming.


Conflict of interest statement

The authors declare no conflict of interest.

Figures

Fig. 1.
Fig. 1.
Response of temperature and per capita GDP to global warming. (A) The ensemble-mean difference in annual temperature between the CMIP5 Historical and Natural forcing experiments during the IPCC’s historical baseline period (1986–2005). (B) The annual temperature for selected countries from historical observations [black; calculated as in Burke et al. (14)] and the world without anthropogenic climate forcing (gray). Overlaid on the country-level temperatures are the response functions containing the 10th (red), 50th (orange), and 90th (yellow) percentile temperature optima, calculated across the 1,000 temperature optima generated by the bootstrap replication of the regression. The full distribution of temperature optima from ref. is shown in the gray box; as in ref. , darker red colors indicate cooler temperature optima and thus greater likelihood of negative impacts from warming. (C and D) The impact of anthropogenic climate forcing on annual economic growth rate, and accumulated impact on per capita GDP, for Norway and India.
Fig. 2.
Fig. 2.
Country-level economic response to global warming. (A) The median impact on country-level per capita GDP across the >20,000 realizations of the world without anthropogenic forcing, calculated for each country over the 1961–2010 period. (B) As in A, but for the 1991–2010 period. Differences in the presence/absence of countries between the 1961–2010 and 1991–2010 periods reflect differences in the availability of country-level economic data. Differences in the magnitude of country-level values between the 1961–2010 and 1991–2010 periods reflect the influence of accumulation time on the net accumulated economic impact. (C and D) The probability that historical anthropogenic forcing has resulted in economic damage, calculated as the percentage of the >20,000 realizations that show a decrease in per capita GDP relative to the counterfactual world without anthropogenic forcing.
Fig. 3.
Fig. 3.
Relationship between economic impact of global warming and country-level temperature, GDP, and cumulative CO2 emissions. (A) The relationship between country-level mean annual temperature and median economic impact of anthropogenic forcing over the 1961–2010 period. The orange line shows the median temperature optimum reported by Burke et al. (14), and the orange envelope shows the 5–95% range. (B) The relationship between per capita GDP in 2010 and median economic impact of historical anthropogenic forcing over the 1961–2010 period. (C) The relationship between cumulative emissions over the 1961–2010 period (calculated from ref. 32) and median economic impact of historical anthropogenic forcing over the 1961–2010 period. (AC) Gray strip plots show the density of points along the x and y axes. The black regression line and gray envelope show the 95% confidence interval of a locally weighted regression (“loess”).
Fig. 4.
Fig. 4.
Impact of global warming on country-level inequality over the past half century. (A) The ratio between the population-weighted 90th percentile and 10th percentile country-level per capita GDP for the historical observed time series and each of the >20,000 realizations of the world without anthropogenic forcing. (B) The density of the >20,000 realizations at each decile of the population-weighted country-level per capita GDP distribution. (C) The distribution across the >20,000 realizations of percent change in population-weighted 90:10 and 80:20 percentile ratios in the year 2010, relative to the present ratio. Calculations include only those countries that have continuous socioeconomic data from 1961 through 2010 (n = 86).

Comment in

  • Reply to Rosen: Temperature-growth relationship is robust.
    Diffenbaugh NS, Burke M. Diffenbaugh NS, et al. Proc Natl Acad Sci U S A. 2019 Aug 13;116(33):16171-16172. doi: 10.1073/pnas.1908772116. Epub 2019 Aug 2. Proc Natl Acad Sci U S A. 2019. PMID: 31375623 Free PMC article. No abstract available.
  • Temperature impact on GDP growth is overestimated.
    Rosen RA. Rosen RA. Proc Natl Acad Sci U S A. 2019 Aug 13;116(33):16170. doi: 10.1073/pnas.1908081116. Epub 2019 Aug 2. Proc Natl Acad Sci U S A. 2019. PMID: 31375624 Free PMC article. No abstract available.

Similar articles

Cited by

References

    1. Intergovernmental Panel on Climate Change . In: Climate Change 2014: Impacts, Adaptation, and Vulnerability. Contribution of Working Group II to the Fifth Assessment Report of the Intergovernmental Panel on Climate Change. Field CB, et al., editors. Cambridge Univ Press; Cambridge, UK: 2014. pp. 1–32.
    1. Hallegatte S, Rozenberg J. Climate change through a poverty lens. Nat Clim Chang. 2017;7:250–256.
    1. Intergovernmental Panel on Climate Change . In: Managing the Risks of Extreme Events and Disasters to Advance Climate Change Adaptation. Field CB, et al., editors. Cambridge Univ Press; Cambridge, UK: 2012.
    1. Burke M, Hsiang SM, Miguel E. Global non-linear effect of temperature on economic production. Nature. 2015;527:235–239. - PubMed
    1. Hsiang S, et al. Estimating economic damage from climate change in the United States. Science. 2017;356:1362–1369. - PubMed

Publication types