

Forty-six years of Greenland Ice Sheet mass balance from 1972 to 2018
- PMID: 31010924
- PMCID: PMC6511040
- DOI: 10.1073/pnas.1904242116
Forty-six years of Greenland Ice Sheet mass balance from 1972 to 2018
Abstract
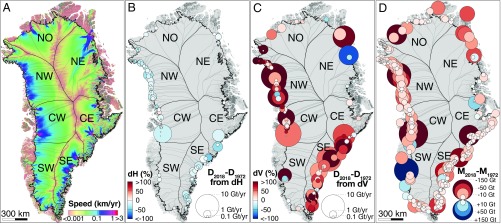
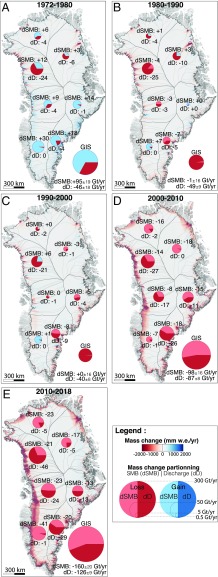
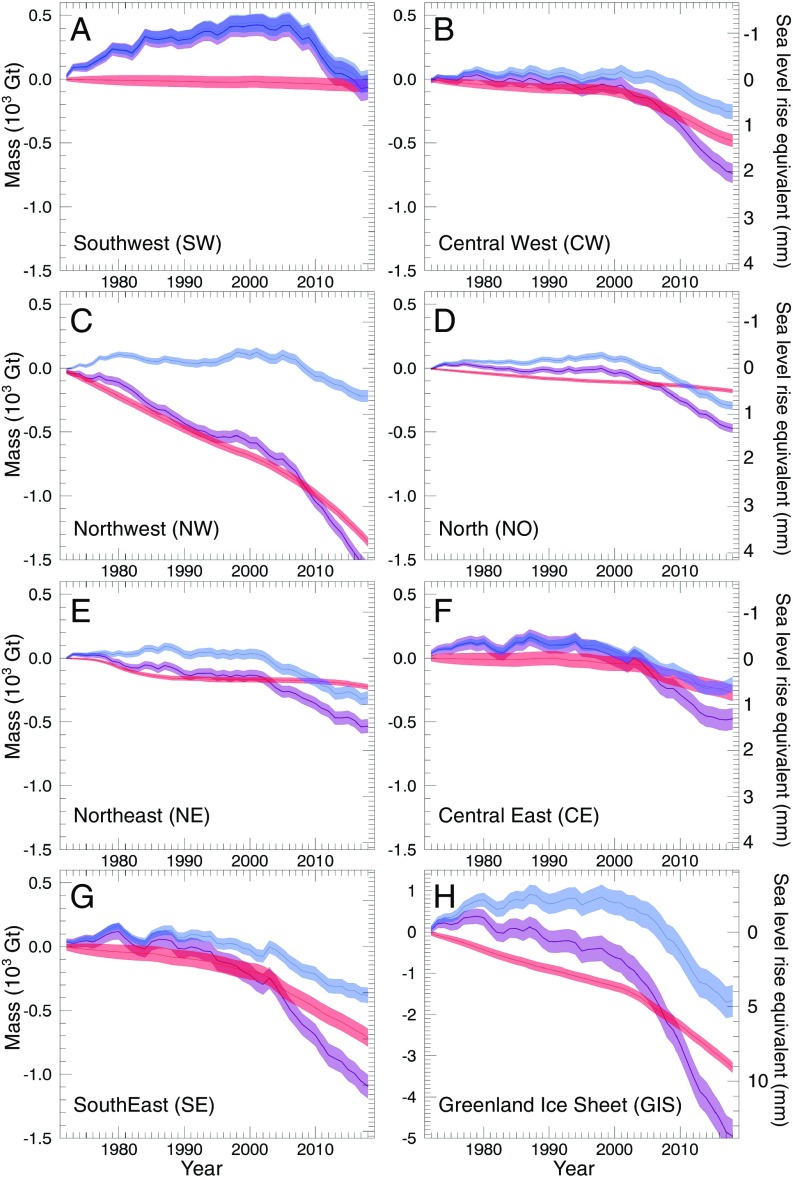
We reconstruct the mass balance of the Greenland Ice Sheet using a comprehensive survey of thickness, surface elevation, velocity, and surface mass balance (SMB) of 260 glaciers from 1972 to 2018. We calculate mass discharge, D, into the ocean directly for 107 glaciers (85% of D) and indirectly for 110 glaciers (15%) using velocity-scaled reference fluxes. The decadal mass balance switched from a mass gain of +47 ± 21 Gt/y in 1972-1980 to a loss of 51 ± 17 Gt/y in 1980-1990. The mass loss increased from 41 ± 17 Gt/y in 1990-2000, to 187 ± 17 Gt/y in 2000-2010, to 286 ± 20 Gt/y in 2010-2018, or sixfold since the 1980s, or 80 ± 6 Gt/y per decade, on average. The acceleration in mass loss switched from positive in 2000-2010 to negative in 2010-2018 due to a series of cold summers, which illustrates the difficulty of extrapolating short records into longer-term trends. Cumulated since 1972, the largest contributions to global sea level rise are from northwest (4.4 ± 0.2 mm), southeast (3.0 ± 0.3 mm), and central west (2.0 ± 0.2 mm) Greenland, with a total 13.7 ± 1.1 mm for the ice sheet. The mass loss is controlled at 66 ± 8% by glacier dynamics (9.1 mm) and 34 ± 8% by SMB (4.6 mm). Even in years of high SMB, enhanced glacier discharge has remained sufficiently high above equilibrium to maintain an annual mass loss every year since 1998.
Keywords: Greenland; climate change; glaciers; glaciology; sea level.
Copyright © 2019 the Author(s). Published by PNAS.
Conflict of interest statement
The authors declare no conflict of interest.
Figures
References
-
- Rignot E, Box JE, Burgess E, Hanna E. Mass balance of the Greenland ice sheet from 1958 to 2007. Geophys Res Lett. 2008;35:1–5.
-
- Rignot E, Velicogna I, van den Broeke M, Monaghan A, Lenaerts J. Acceleration of the contribution of the Greenland and Antarctic ice sheets to sea level rise. Geophys Res Lett. 2011;38:1–5.
-
- Khan SA, et al. Greenland ice sheet mass balance: A review. Rep Prog Phys. 2015;78:046801. - PubMed
-
- Enderlin EM, et al. An improved mass budget for the Greenland ice sheet. Geophys Res Lett. 2014;41:866–872.
-
- Kjeldsen KK, et al. Spatial and temporal distribution of mass loss from the Greenland Ice Sheet since AD 1900. Nature. 2015;528:396–400. - PubMed
