. 2019 May;25(5):805-813.
doi: 10.1038/s41591-019-0415-5. Epub 2019 Apr 22.

A signature of circulating inflammatory proteins and development of end-stage renal disease in diabetes

Affiliations

A signature of circulating inflammatory proteins and development of end-stage renal disease in diabetes

Monika A Niewczas et al. Nat Med. 2019 May.

Abstract

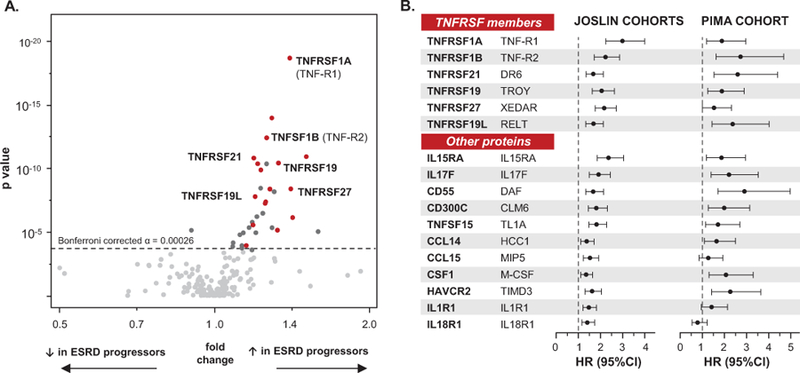
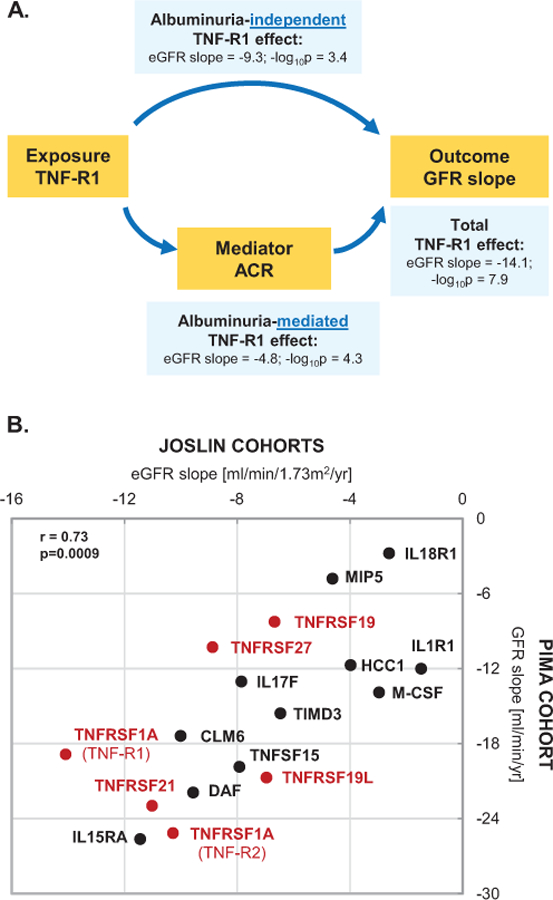
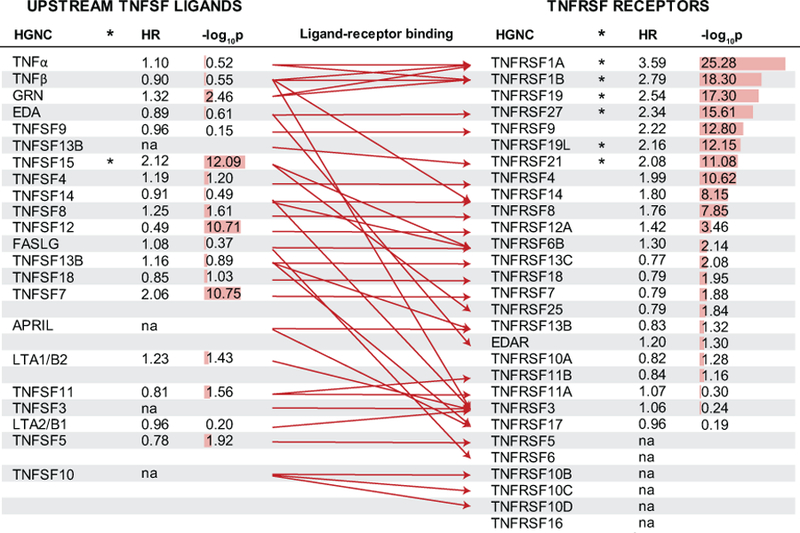
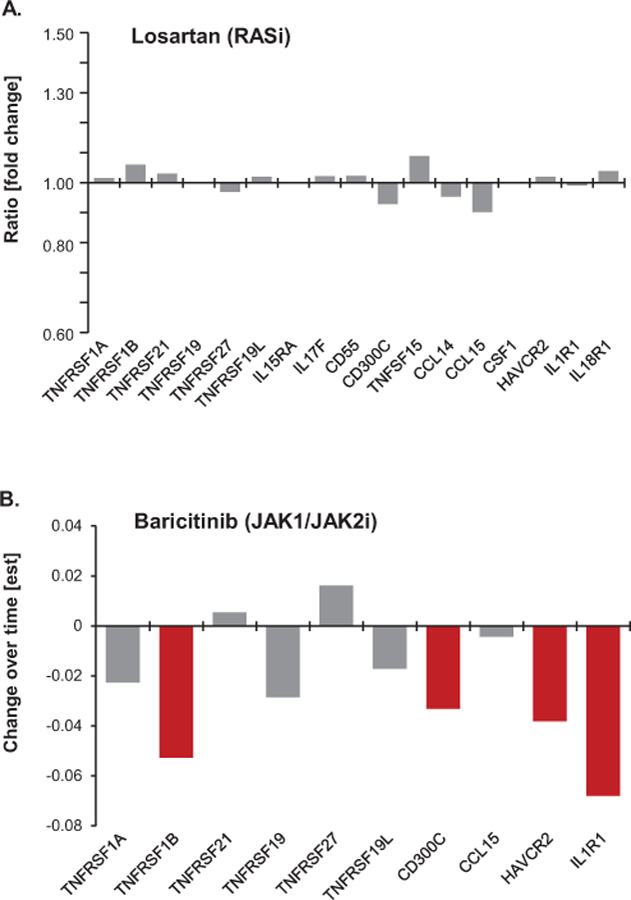
Chronic inflammation is postulated to be involved in the development of end-stage renal disease in diabetes, but which specific circulating inflammatory proteins contribute to this risk remain unknown. To study this, we examined 194 circulating inflammatory proteins in subjects from three independent cohorts with type 1 and type 2 diabetes. In each cohort, we identified an extremely robust kidney risk inflammatory signature (KRIS), consisting of 17 proteins enriched in tumor necrosis factor-receptor superfamily members, that was associated with a 10-year risk of end-stage renal disease. All these proteins had a systemic, non-kidney source. Our prospective study findings provide strong evidence that KRIS proteins contribute to the inflammatory process underlying end-stage renal disease development in both types of diabetes. These proteins point to new therapeutic targets and new prognostic tests to identify subjects at risk of end-stage renal disease, as well as biomarkers to measure responses to treatment of diabetic kidney disease.


Conflict of interest statement

Competing Interest Statement:

ASK and MAN are co-inventors of the TNF-R1 and TNF-R2 patent for predicting risk of ESRD. This patent was licensed by the Joslin Diabetes Center to EKF Diagnostics.

The other authors of this report declare no competing conflicts of interest.

Figures

Figure 1.
Figure 1.. Aptamer-based proteomic discovery of a circulating Kidney Risk Inflammatory Signature (KRIS) associated with long-term risk of development of ESRD in three prospective cohorts. (A) Multivariate screening in the T1D Joslin Cohort (Discovery, n=219) and T2D Joslin Cohort (Validation, n=144) – volcano plot. (B) KRIS proteins and 10-year risk of developing ESRD in Joslin Cohorts (n=363) and in Pima Cohort (Replication, n=162) in the adjusted Cox models. Legend.
(A) Effect sizes (fold change – x-axis) and strengths of associations (p value – y axis) with ESRD risk are presented in T1D Joslin Discovery Cohort. Fold change is a ratio of mean concentration of a protein in subjects who developed ESRD over mean concentration of the same protein in subjects who did not develop ESRD during follow-up. To test significance two-group comparison in the linear regression model with caseness as an independent variable and protein concentrations transformed to their base 10 logarithms as the respective dependent variable was used (two sided p value). Significant thresholds used: in T1D Cohort: α = 0.00026 (Bonferroni corrected for 194 proteins measured) and in T2D Joslin Validation Cohort: α=0.01. Seventeen significant proteins (KRIS), for which the associations were confirmed in the two Joslin Cohorts, are marked with red dots; proteins significant in T1D Joslin Cohort, but not confirmed in T2D Joslin Cohort are marked with dark grey dots; non-significant proteins are marked with grey dots. Please see also Table 2. HGNC - protein symbol according to the HUGO Gene Nomenclature Committee. (B) Effect of KRIS proteins on risk of ESRD in the combined T1D and T2D Joslin Cohorts and in Pima Indians Cohort. Cox proportional hazards model analyzed time to onset of ESRD within 10 years. Effect is shown as hazard ratio per one tertile change in circulating concentration of specific KRIS protein. Models are controlled for type of diabetes (Joslin only), age, HbA1c and eGFR (Joslin) or GFR (Pima). Comprehensive models considering a number of adjustments are presented in the Supplementary Table 2.
Figure 2.
Figure 2.. Albuminuria-independent and albuminuria-mediated effect of circulating KRIS proteins on progressive renal function decline. (A) Conceptual framework of the mediation model used in the study. (B) Correlation plot of total effects of KRIS proteins between Joslin Cohorts and Pima Cohort. Legend.
(A) Directed acyclic graph conceptualizing possible etiological relationships. The graph is not exhaustive. Effect of the top KRIS protein, TNF-R1 on the renal slope in the Joslin Cohorts is exercised as an example. eGFR slope estimates represent total and decomposed effects of renal function loss in ml/min/1.73m2/yr per an increase in one unit of a KRIS protein transformed to its base 10 logarithms (β estimates). For example, an increase in one log10unit of TNF-R1 is associated with a rapid eGFR loss of 14ml/min/1.73m2/yr, meaning that a typical Joslin T1D Cohort study subject with proteinuria and CKD3 would develop ESRD in 3 years. Mediation models are described below. (B) Total effects represent β estimates of eGFR loss in ml/min/1.73m2/yr (Joslin Cohorts, n=363) and of GFR loss in ml/min/yr (Pima Cohort, n=162) per an increase of one unit of a KRIS protein transformed to its base 10 logarithms. Model is adjusted for age, HbA1c, baseline eGFR (Joslin Study) or GFR (Pima Study), whereas ACR is evaluated as a mediator of the effect (two sided p values). Total effect estimates for TNFRSF members are marked with red dots and for other KRIS proteins with black dots. Spearman rank coefficient and corresponding p value (upper right-hand side) represents correlations between total effect estimates between the cohorts. All p values are two sided. Please see the corresponding Supplementary Table 3 for details on effect decompositions.
Figure 3.
Figure 3.. TNF Receptor Superfamily (TNFRSF), their corresponding ligands (TNFSFL) and ESRD risk in the Joslin Cohorts. Legend.
TNFRSF members are ordered according to strength of association with time to onset of ESRD in Cox regression models based on the two Joslin Cohorts (n=363). Effect (hazard ratio) is shown per one tertile change in baseline concentration of relevant protein. Corresponding strength of the association is provided as a numeric two sided p value transformed to its base 10 logarithm and as a red bar. Six TNFRSF members and one TNFSF member marked with an asterisk are part of the KRIS. Literature-curated ligand-receptor binding is presented with a red arrow. Abbreviations: ESRD – End Stage Renal Disease, HR – hazard ratio, HGNC – protein name according to the HUGO Gene Nomenclature Committee. na –not measured.
Figure 4.
Figure 4.. KRIS as a potential biomarker of a response to the treatment. Impact of the interventional treatment in DKD on changes in circulating KRIS protein levels (two independent clinical trials). (A) Losartan (RASi) study. (B) Baricitinib (JAK1/2 inhibitor) study. Legend.
(A) Comparison of plasma KRIS protein levels between treated and placebo groups while on treatment. Ratios of median KRIS levels between the groups are presented on the y axis. Grey bars denote insignificant changes. Protein measurements were performed on the SOMAscan platform. (B) Differences in circulating KRIS levels between the 4mg dose baricitinib and placebo groups following 24 weeks of treatment. Effect estimate on y axis is based on the longitudinal analysis of response profiles per one unit of a protein change transformed to its base 10 logarithms. Red bars denote proteins for which differences in KRIS protein levels over time were significantly different (p<0.05) in the treated group in comparison with placebo. Grey bars denote insignificant changes. Protein measurements were performed with Olink Inc. technology.

Comment in

References

    1. Gregg EW, et al. Changes in diabetes-related complications in the United States, 1990–2010. N Engl J Med 370, 1514–1523 (2014). - PubMed
    1. Macisaac RJ, Ekinci EI & Jerums G Markers of and risk factors for the development and progression of diabetic kidney disease. Am J Kidney Dis 63, S39–62 (2014). - PubMed
    1. Pichler R, Afkarian M, Dieter BP & Tuttle KR Immunity and inflammation in diabetic kidney disease: translating mechanisms to biomarkers and treatment targets. Am J Physiol Renal Physiol 312, F716–F731 (2017). - PMC - PubMed
    1. Niewczas MA, et al. Circulating TNF receptors 1 and 2 predict ESRD in type 2 diabetes. J Am Soc Nephrol 23, 507–515 (2012). - PMC - PubMed
    1. Skupien J, et al. Synergism between circulating tumor necrosis factor receptor 2 and HbA(1c) in determining renal decline during 5–18 years of follow-up in patients with type 1 diabetes and proteinuria. Diabetes Care 37, 2601–2608 (2014). - PMC - PubMed

Publication types

MeSH terms