Clinical Trial
. 2019 May;25(5):751-758.
doi: 10.1038/s41591-019-0424-4. Epub 2019 Apr 22.

Genomic and transcriptomic profiling expands precision cancer medicine: the WINTHER trial

Affiliations
Clinical Trial

Genomic and transcriptomic profiling expands precision cancer medicine: the WINTHER trial

Jordi Rodon et al. Nat Med. 2019 May.

Abstract

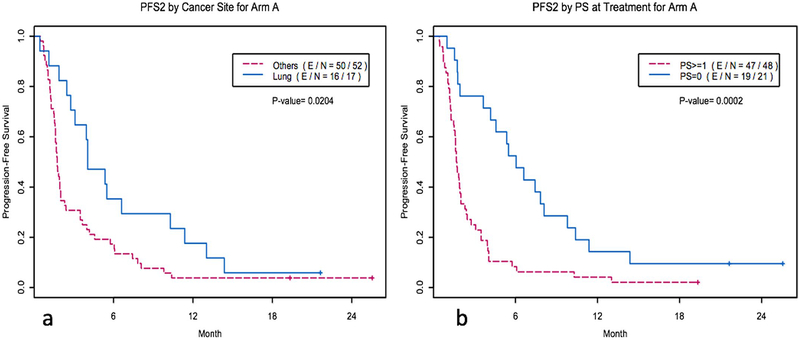
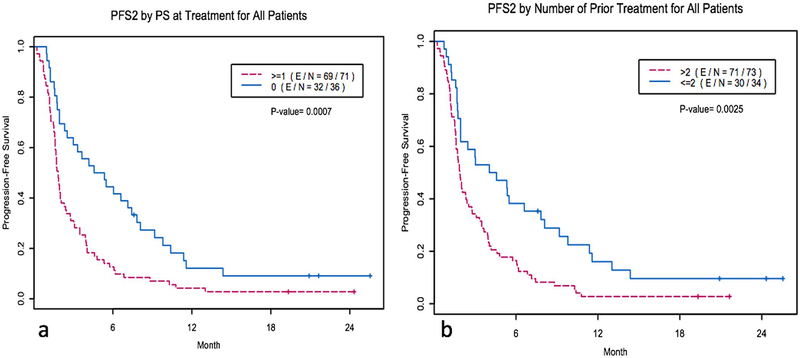
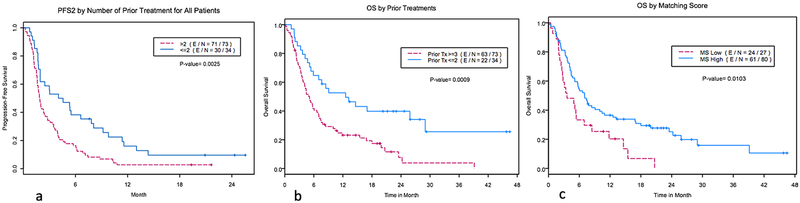
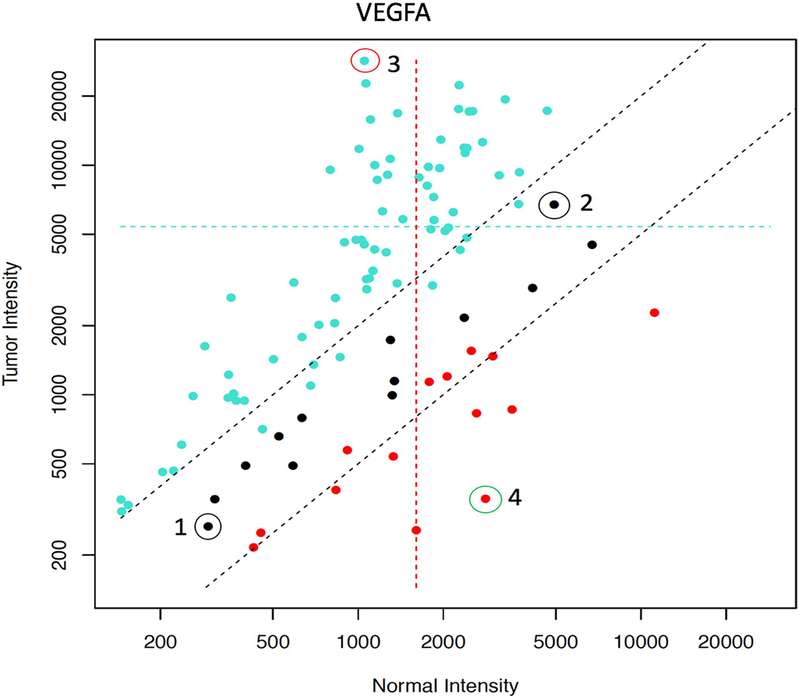
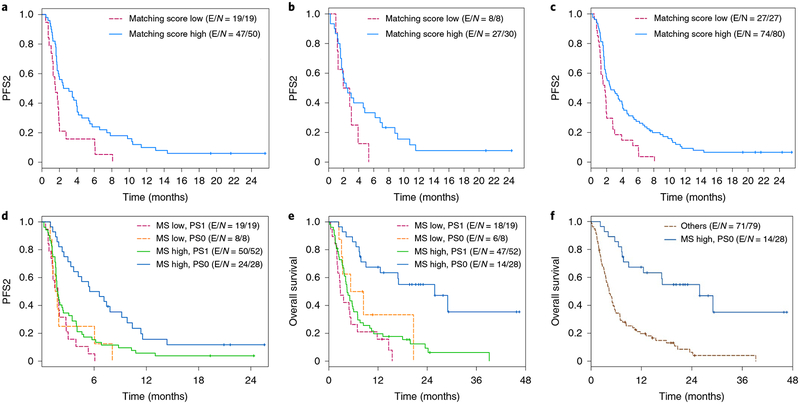
Precision medicine focuses on DNA abnormalities, but not all tumors have tractable genomic alterations. The WINTHER trial ( NCT01856296 ) navigated patients to therapy on the basis of fresh biopsy-derived DNA sequencing (arm A; 236 gene panel) or RNA expression (arm B; comparing tumor to normal). The clinical management committee (investigators from five countries) recommended therapies, prioritizing genomic matches; physicians determined the therapy given. Matching scores were calculated post-hoc for each patient, according to drugs received: for DNA, the number of alterations matched divided by the total alteration number; for RNA, expression-matched drug ranks. Overall, 303 patients consented; 107 (35%; 69 in arm A and 38 in arm B) were evaluable for therapy. The median number of previous therapies was three. The most common diagnoses were colon, head and neck, and lung cancers. Among the 107 patients, the rate of stable disease ≥6 months and partial or complete response was 26.2% (arm A: 23.2%; arm B: 31.6% (P = 0.37)). The patient proportion with WINTHER versus previous therapy progression-free survival ratio of >1.5 was 22.4%, which did not meet the pre-specified primary end point. Fewer previous therapies, better performance status and higher matching score correlated with longer progression-free survival (all P < 0.05, multivariate). Our study shows that genomic and transcriptomic profiling are both useful for improving therapy recommendations and patient outcome, and expands personalized cancer treatment.


Conflict of interest statement

Competing interests

J.Rodon reports non-financial support and reasonable reimbursement for travel from the European Journal of Cancer, Vall d’Hebron Institut of Oncology, the Chinese University of Hong Kong, SOLTI, Elsevier, GlaxoSmithKline; receives consulting and travel fees from Novartis, Eli Lilly, Orion Pharmaceuticals, Servier Pharmaceuticals, Peptomyc, Merck Sharp & Dohme, Kelun Pharmaceutical/Klus Pharma, Spectrum Pharmaceuticals, Pfizer, Roche Pharmaceuticals and Ellipses Pharma (including serving on the scientific advisory board from 2015 to present); receives research funding from Bayer and Novartis; and serves as investigator in clinical trials with Spectrum Pharmaceuticals, Tocagen, Symphogen, BioAtla, Pfizer, GenMab, CytomX, Kelun Pharmaceutical/Klus Pharma, Takeda-Millenium, GlaxoSmithKline and Ipsen. J.-C.S. received consultancy fees from AstraZeneca, Roche, Sanofi, Servier, Pierre Fabre and is a full-time employee of Medimmune/AstraZeneca since September 2017. W.H.M. receives speaking and/or consulting fees from BMS, Merck, Roche, Novartis and Amgen. E.R. received consultant fees from Teva, Carmentix and Hinoman, is receiving consultant fees from Equinom and has ownership interest in Carmentix. A.O. receives consulting fees from Roche Israel, MSD Israel, Boehringer Ingelheim and AstraZeneca. A.T. received consultant fees from Roche and receives research funding from EMD Serono, Baxter, Foundation Medicine, ONYX and Bayer. PS. collaborates in research with Roche, AstraZeneca, BMS and Novartis. I.B. receives consultant fees from Orion Pharma, receives speaking fees from BMS, AstraZeneca and Merck Serono, and is principal investigator and receives funding for clinical trials from AstraZeneca, BMS, Celgene, Gliknik, GSK, Janssen, KURA, MSD, Novartis, Orion Pharma and Pfizer. Y.L. collaborates in research with Merck, Roche, AstraZeneca, Sanofi, Pfizer, Janssen, Astellas and BMS. M.A. is an employee and shareholder of Ariana Pharmaceuticals. VM. is an employee (salary and equity) of Foundation Medicine. J.-F.M. is a full-time employee and stockholder of Pfizer. G.B. collaborates in formal clinical trial contracts, investigator initiated trials (IITs) and in joint grants funded by the Canadian and Quebec governments with Roche, Merck, Novartis, AstraZeneca, Bayer, Esperas, Aurka, Caprion and MRM-P. J.T. declares a scientific consultancy role for Array Biopharma, AstraZeneca, Bayer, BeiGene, Boehringer Ingelheim, Chugai, Genentech, Genmab A/S, Halozyme, Imugene, Inflection Biosciences, Ipsen, Kura Oncology, Lilly, MSD, Menarini, Merck Serono, Merrimack, Merus, Molecular Partners, Novartis, Peptomyc, Pfizer, Pharmacyclics, ProteoDesign SL, Rafael Pharmaceuticals, F. Hoffmann-La Roche, Sanofi, SeaGen, Seattle Genetics, Servier, Symphogen, Taiho, VCN Biosciences, Biocartis, Foundation Medicine, HalioDX SAS and Roche Diagnostics. R.K. has research funding from Incyte, Genentech, Merck Serono, Pfizer, Sequenom, Foundation Medicine, Guardant Health, Grifols, Konica Minolta and OmniSeq, as well as consultant fees from LOXO, X-Biotech, Actuate Therapeutics, Roche and NeoMed. She serves as an advisor to Soluventis. She receives speaker fees from Roche and also has equity in IDbyDNA, CureMatch and Soluventis. F.W., C.B. and V.L. are full-time employees of WIN Association-WIN Consortium. WIN Association-WIN Consortium is the owner of the patent family entitled ‘Method for predicting efficacy of drugs in a patient’ (WINTHER). The inventors are V.L., J.-C.S., Michel Ducreux and Thomas Tursz.

Figures

Extended Data Fig. 1 |
Consort diagram.
Extended Data Fig. 2 |
Extended Data Fig. 2 |. Kaplan-Meier curves of various factors influencing PFS and OS.
a, Kaplan-Meier curves of PFS for arm A by cancer site (lung site, N = 17 versus other site, N = 52). PFS2 denotes the PFS of the WINTHER treatment. P = 0.0204 by two-sided log-rank test. b, Kaplan-Meier curves of PFS for arm A by ECOG performance status at treatment (PS = 0, N= 21 versus PS = 1, N = 48). PFS2 denotes the PFS of the WINTHER treatment. P= 0.0002 by two-sided log-rank test.
Extended Data Fig. 3 |
Extended Data Fig. 3 |. Kaplan-Meier curves of various factors influencing PFS and OS.
a, Kaplan-Meier curves of PFS for arm B by age group. Age >60yr, N = 17 versus age ≤60yr, N = 21. PFS2 denotes the PFS of the WINTHER treatment. P = 0.0361 by two-sided log-rank test. b, Kaplan-Meier curves of PFS for arm B by sex. Sex = female, N = 12 versus sex = male, N= 26. PFS2 denotes the PFS of the WINTHER treatment. P = 0.0252 by two-sided log-rank test. c, Kaplan-Meier curves of PFS for arm B by the number of previous treatments. For the number of previous treatments of ≤2, N = 11 versus >2, N = 27. PFS2 denotes the PFS of the WINTHER treatment. P = 0.0066 by two-sided log-rank test.
Extended Data Fig. 4 |
Extended Data Fig. 4 |. Kaplan-Meier curves of various factors influencing PFS and OS.
a, Kaplan-Meier curves of PFS all patients by ECOG PS at treatment. PS = 0, N = 36 versus PS = 1, N = 71. PFS2 denotes the PFS of the WINTHER treatment. P = 0.0007 by two-sided log-rank test. b, Kaplan-Meier curves of PFS of all of the patients by the number of previous treatments. The number of previous treatments of ≤2, N = 34 versus >2, N = 73. PFS2 denotes the PFS of the WINTHER treatment. P= 0.0025 by two-sided log-rank test.
Extended Data Fig. 5 |
Extended Data Fig. 5 |. Kaplan-Meier curves of various factors influencing PFS and OS.
a, Kaplan-Meier curves of OS of all patients by ECOG PS at treatment. PS = 0, N = 36 versus PS = 1, N = 71 (P < 0.0001 by two-sided log-rank test). b, Kaplan-Meier curves of OS all patients by the number of previous treatments (Tx). The number of prior Tx of ≤ 2, N = 34 versus >2, N = 73 (P= 0.0009 by two-sided log-rank test). c, Kaplan-Meier curves of OS of all patients by matching score. MS high, N=80 versus MS low, N = 27 (P = 0.0103 by two-sided log-rank test).
Extended Data Fig. 6 |
Extended Data Fig. 6 |. Effect of individual variability of normal VEGFA RNA expression on the assessment of VEGFA levels in tumors.
On the y axis, the transcript intensity in tumors is shown, and on the x axis the transcript intensity in matched normal biopsies is shown. Intensities are measured as a relative fluorescence unit (RFU) signal as assessed with Agilent microarray technology. Overexpression in the tumor is denoted in turquoise points, underexpression is denoted in red and no change is denoted in black. The twofold threshold (both high and low) is indicated by two dotted black lines. All 101 patients of the WINTHER study with evaluable RNA data were considered. Example 1 shows a patient with a low level of basal expression (300 RFU) in the tumor and 300 RFU in the normal biopsies, with no differential expression between the normal and tumor biopsies. Example 2 shows a patient with a high level of basal expression of 6,000 RFU in the tumor versus 6,000 RFU in the normal biopsies, but again no differential expression between the tumor and normal counterpart. Example 3 marked in turquoise shows the pattern of a higher expression in tumor versus normal tissue. Example 4 marked in red shows the pattern of a lower expression in tumor versus normal tissue. This current study hypothesizes that simultaneously investigating the matched phenotypically normal tissue can help to optimize transcriptomic data. With this approach, each patient serves as his or her own control, hence avoiding the use of pooled tumor or normal tissues. Our data demonstrate that the level of basal gene expression is highly variable between individuals. All patients presented with black points had no differential expression between tumor and normal tissue, but others show a large variability between individuals in the basal level of normal expression of VEGFA.
Fig. 1 |
Fig. 1 |. Kaplan-Meier curves of PFS and OS by matching score and performance status.
a, Kaplan-Meier curves of PFS for arm A by matching score (high: matching score > 0.25 chosen from the recursive partitioning program rpart) for high (N = 50) versus low (N = 19) groups. HR (95% CI) = 0.482 (0.277–0.836); P = 0.008 by two-sided log-rank test. E, event; N, number. b, Kaplan-Meier curves of PFS for arm B by matching score (high: matching score >0.3 chosen from the recursive partitioning program rpart) for high (N = 30) versus low (N = 8) groups. HR (95% CI) = 0.561 (0.245–1.283); P = 0.16 by two-sided log-rank test. c, Kaplan-Meier curves of PFS for all patients by matching score for high (N = 80) versus low (N = 27) groups. HR (95%CI) = 0.487 (0.308–0.771); P = 0.002 by two-sided log-rank test. d, Kaplan-Meier curves of PFS for all patients, showing the top predictive factors issued from the multivariate analysis: the performance status (PS) at consent and the matching score (MS). The four groups are MS low, PS1 (N = 19); MS low, PS0 (N = 8); MS high, PS1 (N = 52); MS high, PS0 (N = 28) (P = 0.0002 by two-sided log-rank test). e, Kaplan-Meier curves of OS for all patients, showing the top predictive factors issued from the multivariate analysis: the performance status at consent and the matching score. The four groups are the same as in panel d; P < 0.0001 by two-sided log-rank test. f, Kaplan-Meier curves of OS for all patients combining the two predictive factors issued from the multivariate analysis: the performance status at consent and the matching score. The two groups are MS high and PS0 (N = 28) and others (MS low and PS> 0) (N = 79); P < 0.0001 by two-sided log-rank test.
Fig. 2 |
Fig. 2 |. Examples of exceptional responses with CT scans.
a, A 72-year-old woman with non-small-cell lung adenocarcinoma progressing after erlotinib and pemetrexed enrolled on the WINTHER trial (November 2014). NGS matches found a EGFR T790M mutation (which leads to a resistance to the drugs available at the time). The WINTHER CMC recommended the EGFR small-molecule inhibitor afatinib with the antibody cetuximab, according to data showing responses with this combination. (Osimertinib (an EGFR inhibitor targeting EGFR T790M) was not yet approved.) Outcome refers to a CR (PFS of 13 months). The left panel is pre-treatment and shows a large lung mass (arrow). The right panel shows tumor resolution (arrow). b, A 68-year-old man with progressive metastatic colorectal cancer after Xelox (capecitabine and oxaliplatin) and FOLFIRI (folinic acid, 5-fluoruracil, irinotecan)-cetuximab. NGS matches found a MSH6 mutation (a mismatch repair gene alteration causing microsatellite instability). The WINTHER CMC recommended pembrolizumab, according to data newly emerging at the time (and later validated) regarding checkpoint inhibitor efficacy in a mismatch repair gene defect setting. Pembrolizumab was initiated in March 2015. Outcome refers to a PR (PFS of >36 months). The left panel shows baseline mediastinal adenopathy (arrow). The right panel shows mediastinal adenopathy regression (arrow). c, A 69-year-old woman with a well-differentiated, neuroendocrine, small gut tumor and peritoneal metastasis underwent debulking surgery and received lanreotide (a long-acting somatostatin analog) for residual disease (April 2011 to June 2012). She then developed bowel obstruction (due to peritoneal progression), which required surgery. The somatostatin analog continued until April 2014, when progression to the liver occurred. Axitinib (on a clinical trial) was given for 10 months before progression. In April 2015, she enrolled on the WINTHER trial. NGS found no DNA alterations; RNA matches revealed AKT2 and AKT3 overexpression. The WINTHER CMC recommended an mTOR inhibitor. Everolimus was started (May 2015). Outcome refers to prolonged disease stabilization (PFS of >34 months). (Everolimus was later approved for this indication in 2016.) The left panel shows baseline liver metastases (arrow). The middle panel shows stable liver metastases (arrow) at 1 yr. The right panel shows ongoing stable liver metastases (arrow) at >34 months. The examples of the exceptional responses shown in a-c can be found in Supplementary Table 4 (ID156, ID183 and ID203, respectively).

Comment in

References

    1. Schwaederle M et al. Association of biomarker-based treatment strategies with response rates and progression-free survival in refractory malignant neoplasms: a meta-analysis. JAMA Oncol. 2, 1452–1459 (2016). - PubMed
    1. Jardim DL et al. Impact of a biomarker-based strategy on oncology drug development: a meta-analysis of clinical trials leading to FDA approval. J. Natl. Cancer Inst. 107, djv253(2015). - PMC - PubMed
    1. Schwaederle M et al. Impact of precision medicine in diverse cancers: a meta-analysis of phase II clinical trials. J. Clin. Oncol 33, 3817–3825 (2015). - PMC - PubMed
    1. Goodman AM et al. Tumor mutational burden as an independent predictor of response to immunotherapy in diverse cancers. Mol.Cancer Ther 16, 2598–2608 (2017). - PMC - PubMed
    1. Tsao MS et al. Erlotinib in lung cancer—molecular and clinical predictors of outcome. N. Engl. J. Med 353, 133–144 (2005). - PubMed

Publication types

MeSH terms

Substances