Case Reports
. 2019 May;25(5):767-775.
doi: 10.1038/s41591-019-0434-2. Epub 2019 Apr 22.

Immunogenic neoantigens derived from gene fusions stimulate T cell responses

Affiliations
Case Reports

Immunogenic neoantigens derived from gene fusions stimulate T cell responses

Wei Yang et al. Nat Med. 2019 May.

Abstract

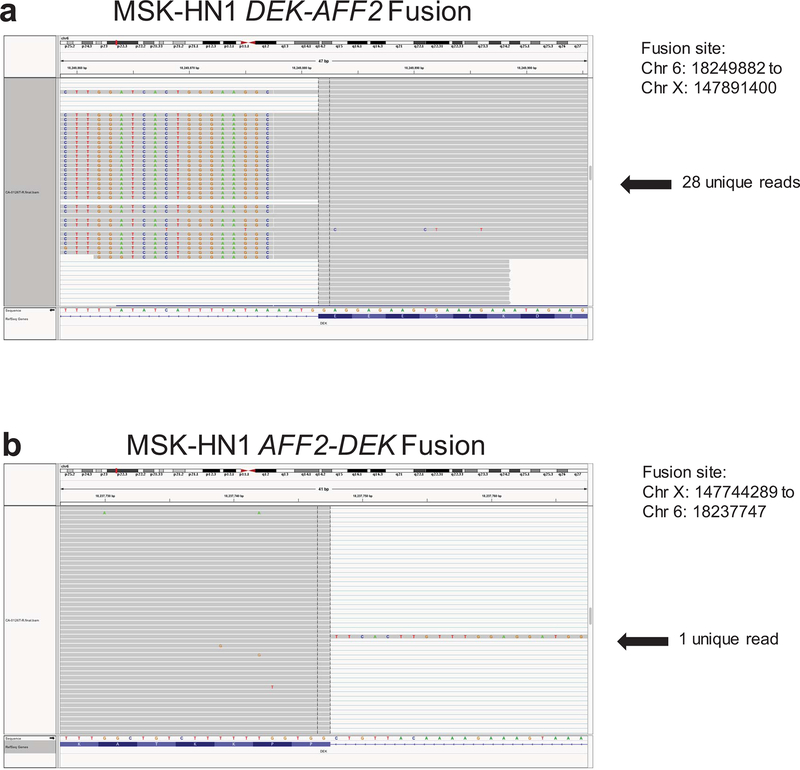
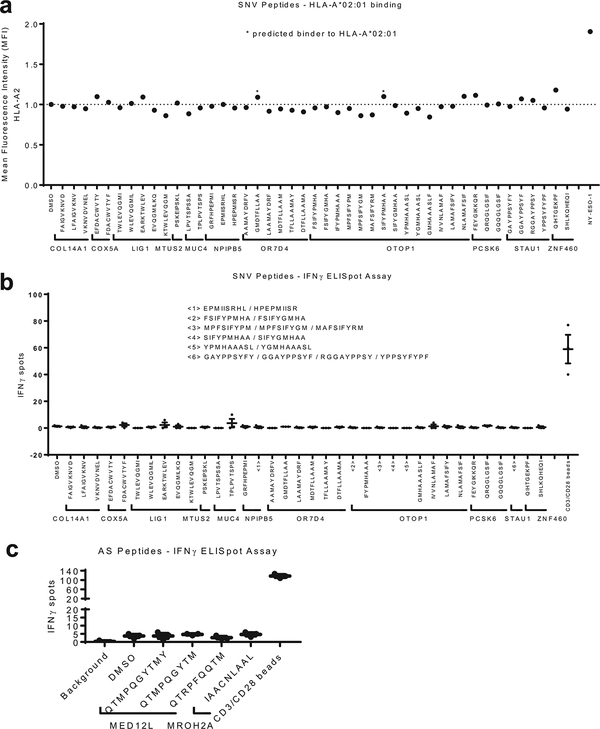
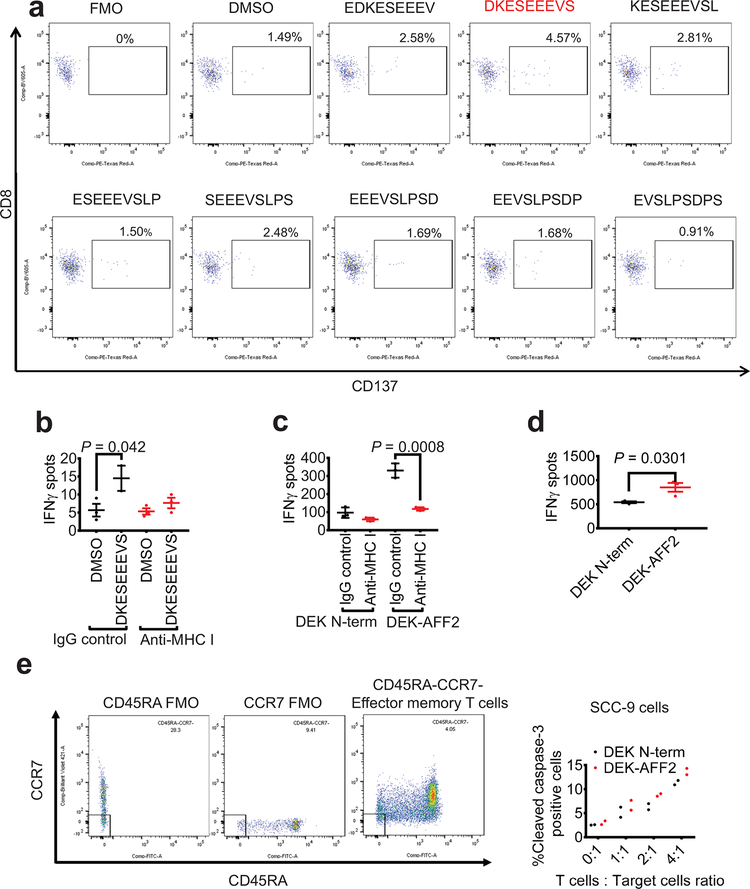
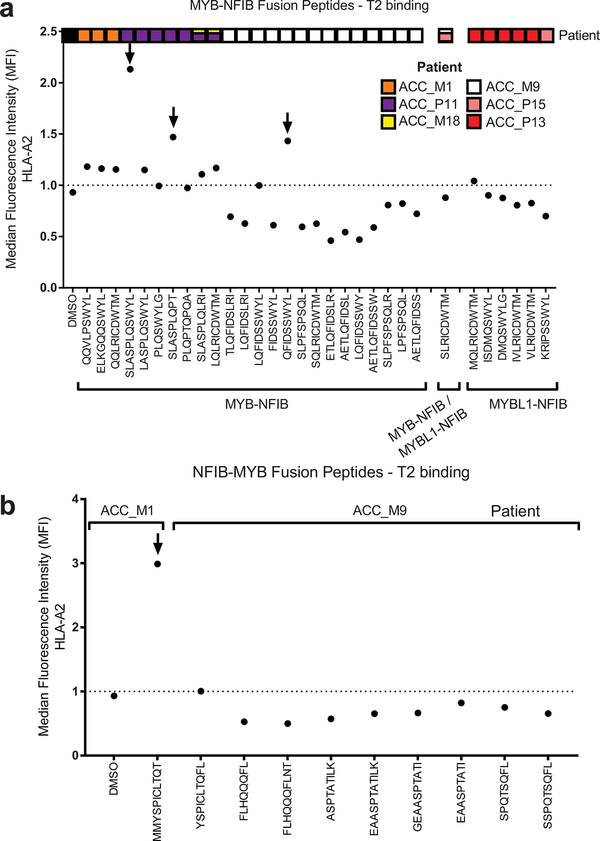
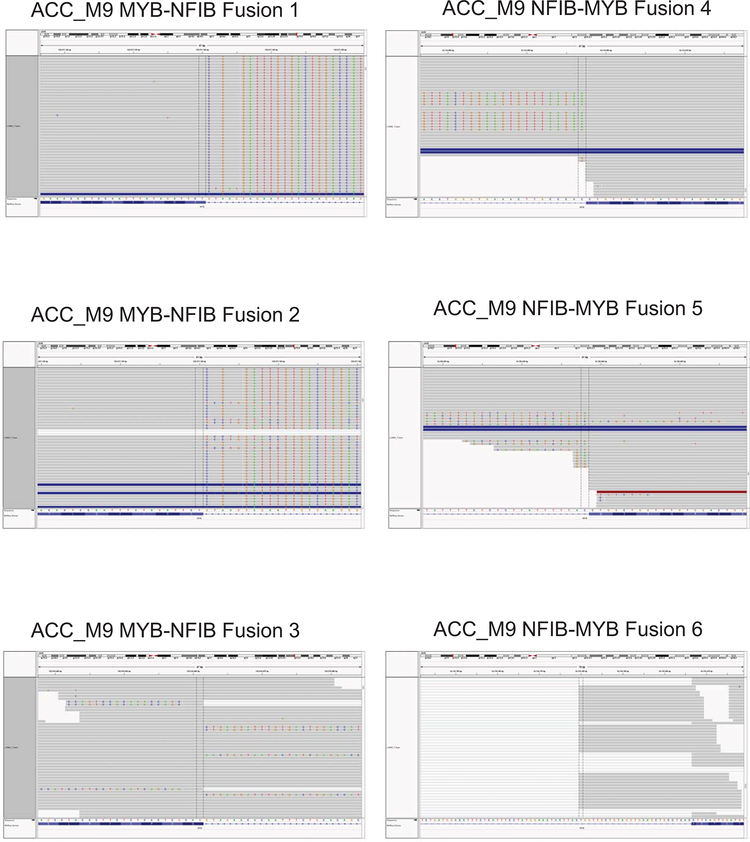
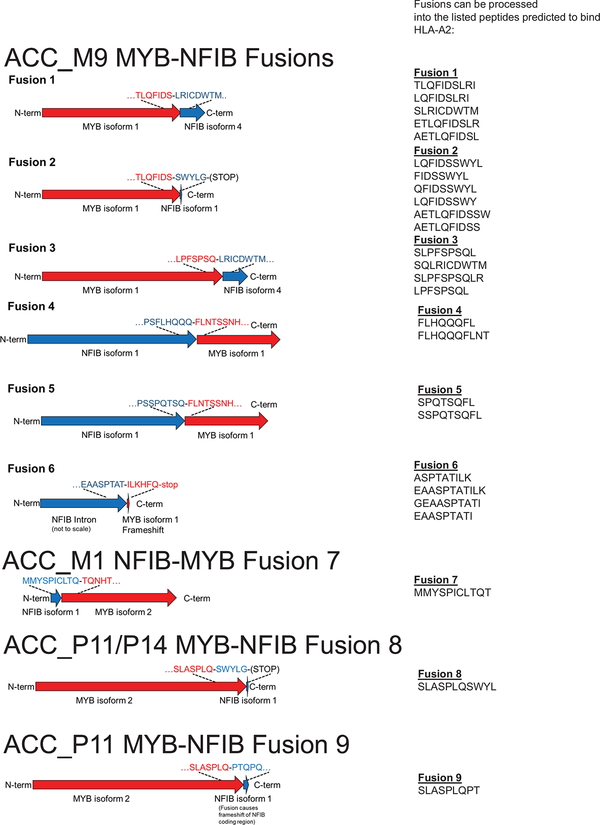
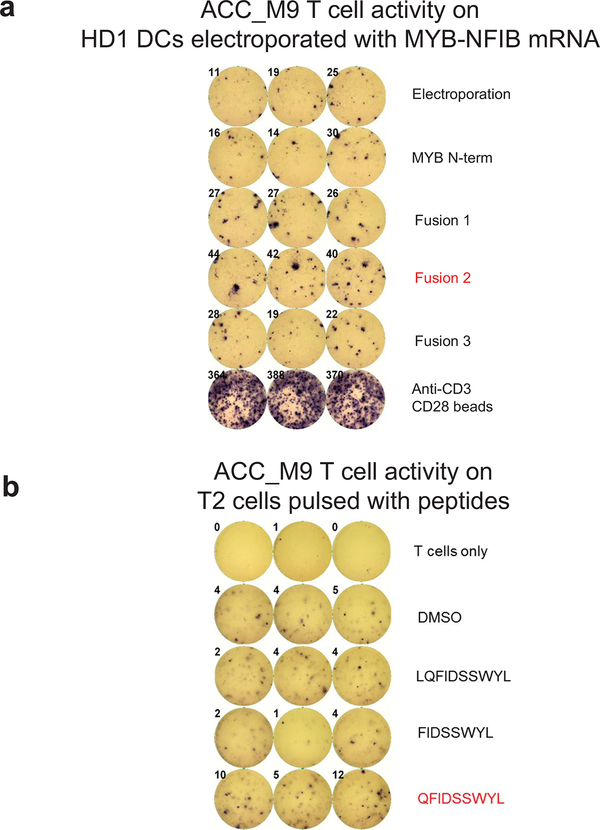
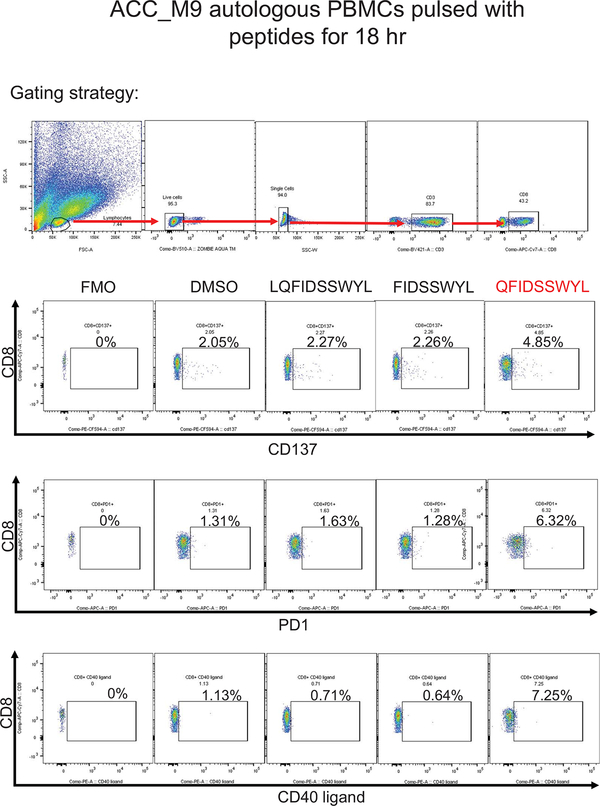
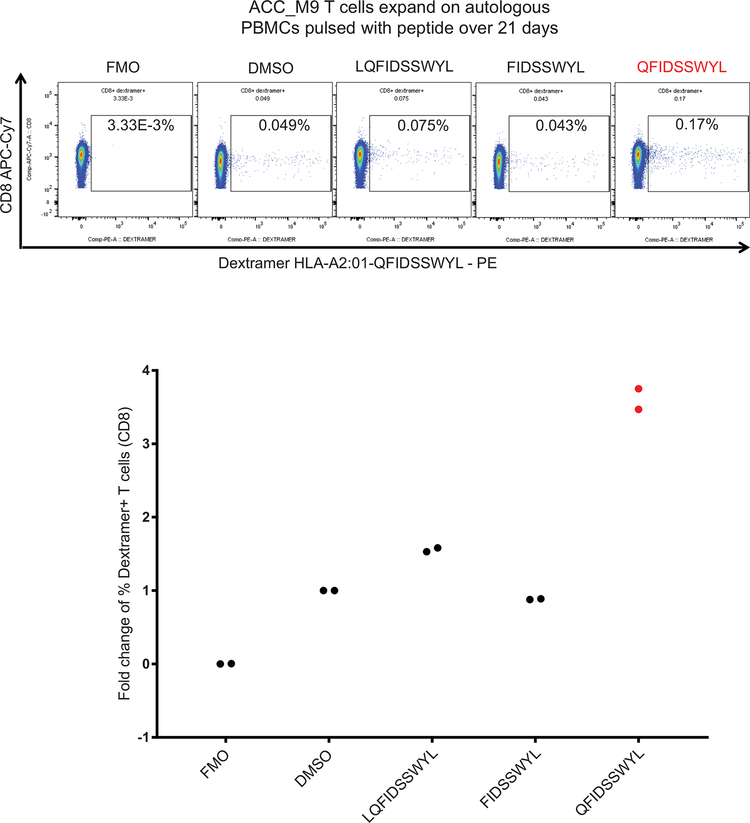
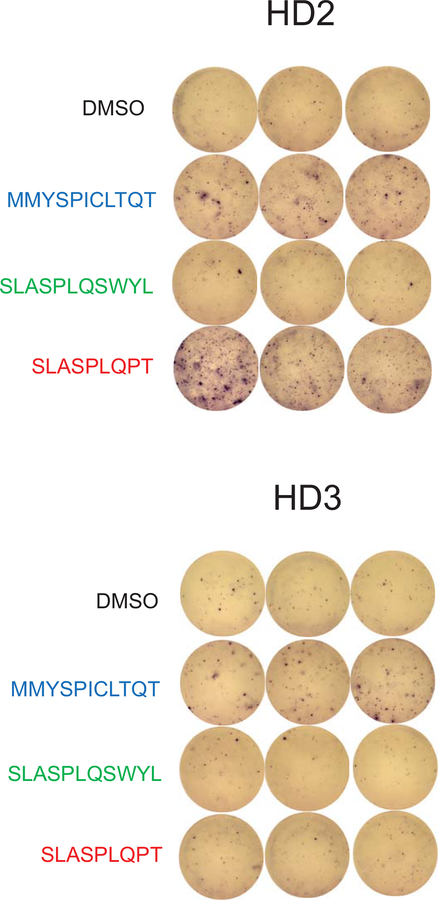
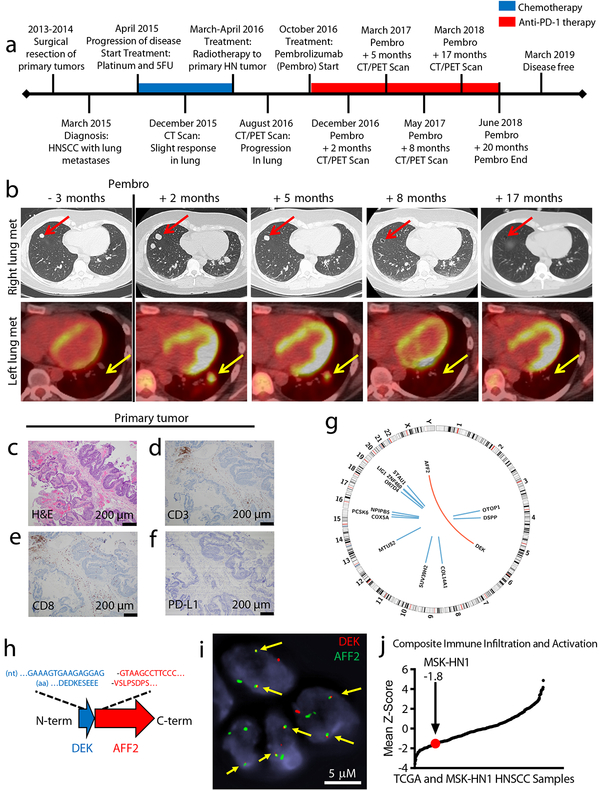
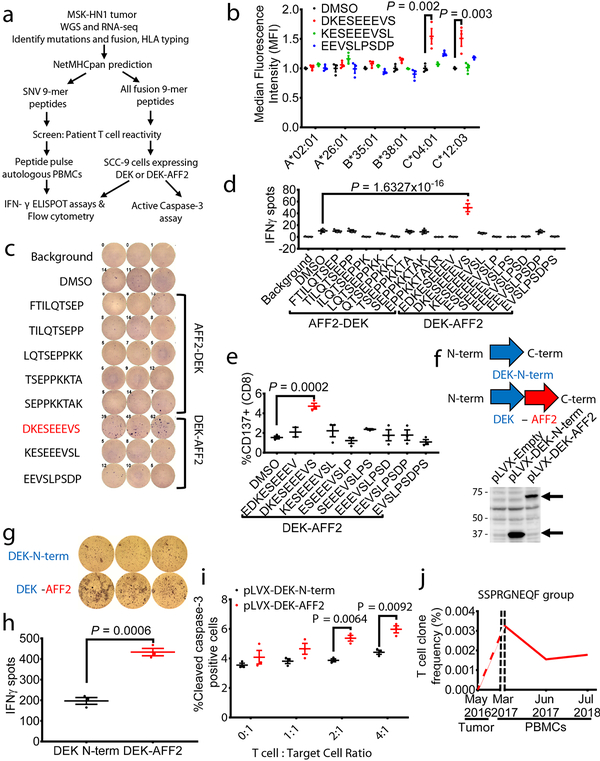
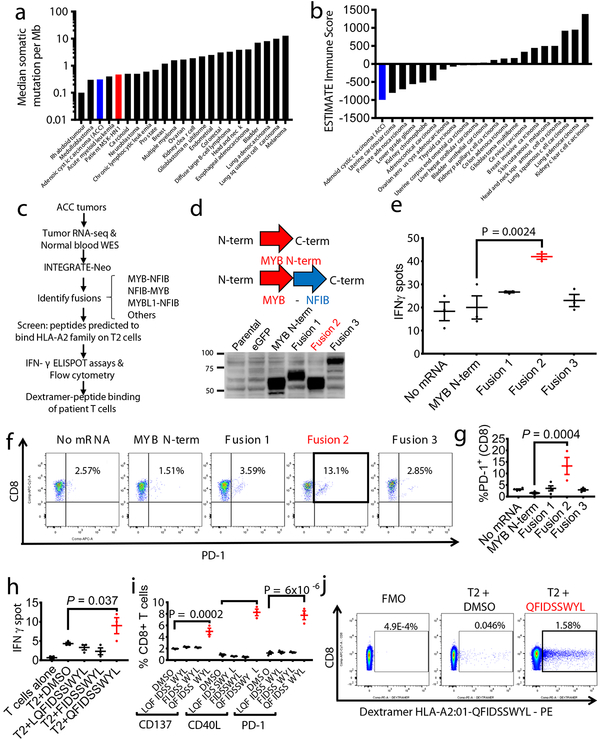
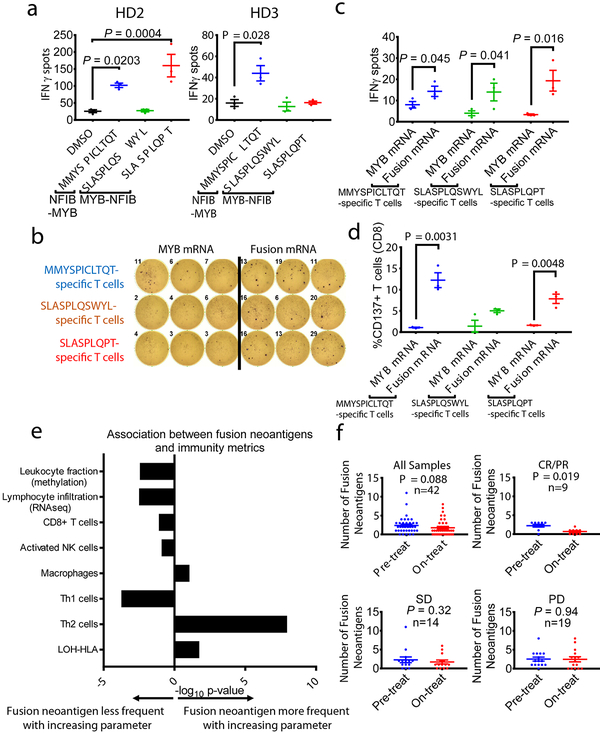
Anti-tumor immunity is driven by self versus non-self discrimination. Many immunotherapeutic approaches to cancer have taken advantage of tumor neoantigens derived from somatic mutations. Here, we demonstrate that gene fusions are a source of immunogenic neoantigens that can mediate responses to immunotherapy. We identified an exceptional responder with metastatic head and neck cancer who experienced a complete response to immune checkpoint inhibitor therapy, despite a low mutational load and minimal pre-treatment immune infiltration in the tumor. Using whole-genome sequencing and RNA sequencing, we identified a novel gene fusion and demonstrated that it produces a neoantigen that can specifically elicit a host cytotoxic T cell response. In a cohort of head and neck tumors with low mutation burden, minimal immune infiltration and prevalent gene fusions, we also identified gene fusion-derived neoantigens that generate cytotoxic T cell responses. Finally, analyzing additional datasets of fusion-positive cancers, including checkpoint-inhibitor-treated tumors, we found evidence of immune surveillance resulting in negative selective pressure against gene fusion-derived neoantigens. These findings highlight an important class of tumor-specific antigens and have implications for targeting gene fusion events in cancers that would otherwise be less poised for response to immunotherapy, including cancers with low mutational load and minimal immune infiltration.


Conflict of interest statement

Competing interests:

K.-W.L. and J.S.S. are now full-time employees of Regeneron Pharmaceuticals. R.M.Srivastava received speaker fees and travel reimbursement from Innovent Biologics, Inc. A.L.H. receives research funding from Eisai, Bristol-Myers Squibb, Kura Oncology, AstraZeneca, Genentech Roche, Celldex, Pfizer, Lilly and Bayer; consulting fees from Bristol-Myers Squibb, Merck, Novartis, AstraZeneca, Regeneron, Sanofi Aventis, Sun Pharmaceuticals, Eisai, Genentech/Roche, Genzyme and Ayala Pharmaceuticals; and travel fees from Ignyta and Kura Oncology. J.J.H’s spouse is a full-time employee of Regeneron Pharmaceuticals. R.M.Samstein, T.A.C. and L.G.T.M. are inventors on a provisional patent application (62/569,053) filed by Memorial Sloan Kettering (MSK) relating to the use of TMB in cancer immunotherapy. D.C. and T.A.C. are inventors on a PCT patent application (PCT/US2015/062208) filed by MSK relating to the use of TMB in cancer immunotherapy. MSK and the inventors may receive a share of commercialization revenue from license agreements relating to these patent applications. TAC is a co-founder of Gritstone Oncology and holds equity. TAC acknowledges grant funding from Bristol-Myers Squibb, AstraZeneca, Illumina, Pfizer, An2H, and Eisai. TAC has served as an advisor for Bristol-Myers Squibb, Illumina, Eisai, and An2H. L.G.T.M. received consulting fees from Rakuten Aspyrian and speaker fees from Physician Educational Resources.

Figures

Extended Data Fig. 1
Extended Data Fig. 1. Visualization of DEK-AFF2 and AFF2-DEK gene fusions
Visualization of the DEK-AFF2 (a) and AFF2-DEK (b) gene fusions in the primary tumor of Patient MSK-HN1 shown on IGV plots of RNA-seq data.
Extended Data Fig. 2
Extended Data Fig. 2. Screen of SNV-derived and alternative splicing-derived 9-mer peptides.
a. A screen for binding of SNV-derived 9-mer peptides (10 µM) to HLA-A*02:01 on T2 cells reveals no peptides with significant binding affinity. The MFI values are normalized to DMSO. NY-ESO-1 was used as a positive control. b. IFN-γ ELISpot assay of Patient MSK-HN1 T cells after 18 hr co-culture with autologous PBMCs (n=3) pulsed with 10 µM of indicated peptides derived from mutations. Due to limited numbers of autologous PBMCs, in several samples (<1>, <2>, <3>, <4>, <5>, and <6>), multiple mutant-derived peptides corresponding to a single wild-type peptide were pulsed together. The grouped peptides are indicated. c. IFN-γ ELISpot assay of Patient MSK-HN1 T cells after 18 hr co-culture with autologous PBMCs (n=3) pulsed with 10 µM of indicated peptides derived from potential alternative splicing events. Means ± s.e.m. are plotted, with sample n representing the number of independently treated samples.
Extended Data Fig. 3
Extended Data Fig. 3. DEK-AFF2 generates an immuno-stimulatory peptide recognized by autologous T cells.
a. Flow cytometry analysis of CD137 expression on CD8+ T cells after 18 hr co-culture with patient MSK-HN1 PBMCs pulsed with indicated peptides. Data are representative of two independent experiments. b. IFN-γ ELISpot assay of Patient MSK-HN1 T cells after 18 hr co-culture with autologous PBMCs (n=3) which have been pulsed with DMSO or DEKSEEEVS peptide, co-treated with either IgG control or anti-MHC Class I antibody overnight. (Two-tailed t-tests, 95%CI=-2.187 to 19.85, Effect size Eta Squared=0.685, P=0.042) c. IFN-γ ELISpot assay of Patient MSK-HN1 T cells after 18 hr co-culture with SCC-9 expressing DEK-N-term or DEK-AFF2 fusion (n=3). Cells are treated with either IgG control or anti-MHC Class I antibody. (Two-tailed t-tests, 95%CI= -278.3 to -147.7, Effect size Eta Squared=0.954, P=0.0008) d. IFN-γ ELISpot assay of Patient MSK-HN1 T cells after 18 hr co-culture with COS-7 cells (n=3) co-transfected with HLA-C*04:01 plasmid and pLVX-DEK-N-term or pLVX-DEK-AFF2. T cells and COS-7 cells were used at 6:1 ratio. (Two-tailed t-test, 95%CI=48.73 to 571.9, Effect size Eta Squared=0.731, P=0.0301). e. Active caspase-3 staining of SCC-9 target cells (n=2) expressing either DEK-N-term or DEK-AFF2 fusion after 3 hr incubation with MSK-HN1 CD8+ TEM cells (CCR7-CD45RA-) at the indicated ratios. Means ± s.e.m. are plotted, with sample n representing the number of independently treated samples.
Extended Data Fig. 4
Extended Data Fig. 4. Screen of HLA binding by fusion peptides predicted to bind to members of HLA-A2 alleles.
The graphs show stabilization of HLA-A*02:01 on the surface of T2 cells by MYB-NFIB and MYBL1-NFIB peptides (a) and NFIB-MYB peptides (b). The peptides in which we further tested are indicated by arrows. Data are representative of two independent experiments.
Extended Data Fig. 5
Extended Data Fig. 5. Validation of MYB-NFIB and NFIB-MYB fusions
Validation of MYB-NFIB and NFIB-MYB fusions expressed in ACC_M9 by visualization on IGV plots of RNA-seq data.
Extended Data Fig. 6
Extended Data Fig. 6. Schematic of ACC_M9, ACC_M1, ACC_P11, ACC_P14-derived MYB-NFIB fusion constructs that were cloned into pcRNA6SL.
The amino acid sequences surrounding the junctions are shown. Predicted HLA-A2-binding peptides derived from each fusion are indicated.
Extended Data Fig. 7
Extended Data Fig. 7. MYB-NFIB generates an immuno-stimulatory peptide recognized by ACC_M9 T cells.
a. IFN-γ ELISpot assay of ACC_M9 T cells after 18 hr co-culture with healthy donor HD1 dendritic cells electroporated with 2 µg of in vitro transcribed mRNA as described in the methods. b. IFN-γ ELISpot assay of ACC_M9 T cells after 18 hr co-culture with T2 cells pulsed with 10 µM of indicated peptides. Data are representative of two independent experiments.
Extended Data Fig. 8
Extended Data Fig. 8. PD-1, CD40L, and CD137 expression on ACC_M9 T cells after 18 hr co-culture with autologous PBMCs pulsed with the indicated peptides.
Flow cytometry analysis of ACC_M9 PBMCs after 18 hr pulse with the indicated peptides (n=3). The immunogenic peptide QFIDSSWYL led to an increased fraction of CD8+ T cells that are CD137+, CD40L+, or PD-1+. Data are representative of three independent experiments.
Extended Data Fig. 9
Extended Data Fig. 9. Patient ACC_M9 CD8+ T cells that specifically bind to HLA-A*02:01-presented QFIDSSWYL peptide proliferate over 21 days during co-culture with irradiated peptide-pulsed T2 cells.
Patient ACC_M9 T cells were expanded on irradiated T2 pulsed with 10 µM of indicated peptides over 21 days and stained with QFIDSSWYL-dextramer-PE. A population of QFIDSSWYL-specific T cells are selectively expanded. Fold-change of dextramer-positive T cells from duplicate experiments were compared with two-tailed t-tests. Data are representative of two independent experiments.
Extended Data Fig. 10
Extended Data Fig. 10. Healthy donor T cells are stimulated by MYB-NFIB-derived and NFIB-MYB-derived peptides.
IFN-γ ELISpot assay of healthy donors HD2 and HD3 T cells after 18 hr co-culture with T2 cells pulsed with 10 µM of indicated peptides. Data are representative of two independent experiments.
Fig. 1 –
Fig. 1 –. Immunogenomic characterization of Patient MSK-HN1, an exceptional responder to anti-PD-1 immunotherapy.
a, Clinical timeline of Patient MSK-HN1 with major events indicated. Chemotherapy treatment is shown in blue and anti-PD-1 therapy is shown in red. b, Serial imaging of a lung metastasis in the right lower lobe (upper panels, CT scans images) and a metastasis in the left lower lobe (lower panels, fused PET/CT images). c, H&E staining of the primary tumor. Scans were done at the times indicated. c-f, Immunohistochemistry staining of the same tissue section for H&E (c), CD3 (d), CD8 (e), and PD-L1 (f). IHC staining was performed twice. g, Circos plot of genomic alterations in the tumor identified with whole-genome sequencing. Blue lines indicate SNVs and the red arc indicates the translocation fusing DEK and AFF2. h, Diagram of the in-frame DEK-AFF2 fusion with nucleotide (nt) and amino acid (aa) sequences surrounding the junction shown. i, FISH detection of the DEK-AFF2 fusion, performed in triplicates. Arrows indicate colocalization of DEK (red) and AFF2 (green). j, Plot of mean Z-scores across TCGA HNSCC samples (n = 521) and Patient MSK-HN1 tumor, representing the composite of eight immune metrics (see Methods).
Fig. 2 –
Fig. 2 –. DEK-AFF2 generates an immuno-stimulatory peptide recognized by autologous T cells.
a, Experimental scheme for testing immunogenicity of mutation- and fusion-associated peptides from Patient MSK-HN1. b, HLA stabilization assay of DEK-AFF2-derived peptides on T2 cells without (HLA-A*02:01) or with transfection of patient-specific HLAs (A*26:01, B*35:01, B*38:01, C*04:01, C*12:03) (n=3). (one-way ANOVA followed by Dunnett’s correction for multiple comparisons. C*04:01 group: 95%CI=−0.8325 to −0.255, Effect size Eta Squared=0.814, DF=8, P=0.002; C*12:03 group: 95%CI=−0.8048 to −0.2115, Eta Squared=0.798, DF=8, P=0.003) c, IFN-γ ELISpot assays of MSK-HN1 T cells (from peripheral blood collected 5 months after initiation of anti-PD-1 therapy) after co-culture with autologous PBMCs (n=3) pulsed with 10 μM AFF2-DEK-derived or DEK-AFF2-derived peptides. 10,000 T cells were used in 1:1 ratio with PBMCs. d, Quantification of IFN-γ spots shown in (c) along with results for additional peptides. (one-way ANOVA followed by Dunnett’s correction for multiple comparisons. 95%CI=−51.52 to −27.14, Effect size Eta Squared=0.934, DF=37, P=1.6×10⁻¹⁶) e, Flow cytometry analysis of CD137 expression of MSK-HN1 T cells after co-culture with autologous PBMCs (n=3) pulsed with 10 μM AFF2-DEK-derived or DEK-AFF2-derived peptides. (one-way ANOVA followed by Dunnett’s correction for multiple comparisons. 95%CI=−4.804 to −1.556, Effect size Eta Squared=0.783, DF=17, P=0.0002). f, Diagram representation of the DEK-N-term and DEK-AFF2 constructs expressed in SCC-9 cells and validation by immunoblotting for DEK. Reference protein molecular weights are indicated (kDa). g, IFN-γ ELISpot assays of MSK-HN1 T cells after co-culture with SCC-9 cells expressing DEK-N-term or DEK-AFF2. The T cell to SCC-9 cell ratio was 1:1. h, Quantification of IFN-γ spots shown in (g) (n=3). (one-way ANOVA followed by Dunnett’s correction for multiple comparisons. 95%CI=169.2 to 304.2, Effect size Eta Squared=0.959, P=0.0006) i, Active caspase-3 staining of SCC-9 target cells expressing either DEK-N-term or DEK-AFF2 fusion after 3 hr incubation with MSK-HN1 T cells at the indicated ratios. T cells were expanded in three rounds on autologous PBMCs pulsed with 10 μM DKESEEEVS peptide prior to culture with 20,000 SCC-9 cells at the indicated ratios. (one-way ANOVA followed by Dunnett’s correction for multiple comparisons. T cell: Target cell ratio 2:1 group: 95%CI=0.7984 to 2.195, Effect size Eta Squared=0.939, P=0.0064; T cell: Target cell ratio 4:1 group: 95%CI=0.7093 to 2.404, Effect size Eta Squared=0.909, P=0.0092) j, DEKSEEEVS-specific T cell clone frequencies in patient tissue/bloods before and during anti-PD1 treatment. All data are representative of two independent experiments. Means ± s.e.m. are plotted, with sample n representing the number of independently treated samples.
Fig. 3 –
Fig. 3 –. MYB-NFIB generates an immuno-stimulatory peptide recognized by autologous T cells.
a, Plot of median tumor mutational burden across 21 TCGA cancer types, adenoid cystic carcinomas,, and Patient MSK-HN1. b, Plot of mean ESTIMATE Immune Scores across 21 TCGA cancer types and adenoid cystic carcinomas. c, Experimental scheme for testing immunogenicity of MYB-NFIB fusion peptides from ACC patients. d, Diagram representation of the MYB-N-term and MYB-NFIB constructs expressed in HEK293 cells and validation by immunoblotting for MYB. Data are representative of two independent experiments. e, Quantification of IFN-γ spots produced by patient T cells after 18 hr co-culture with healthy donor (“HD1”; HLA-A*02:01-positive) DCs (n=3) electroporated with mRNA. (one-way ANOVA followed by Dunnett’s correction for multiple comparisons, 95%CI=−34.96 to −9.044, Effect size Eta Squared=0.782, DF=10, P=0.0024) f, Flow cytometry analysis of PD-1 expression on T cells used in (e). g, Quantification of CD3+ or CD8+ T cells used in (e) that are PD-1+ (n=3). (one-way ANOVA followed by Dunnett’s correction for multiple comparisons, 95%CI=−17.58 to −5.877, Effect size Eta Squared=0.742, DF=13, P=0.0004) h, Quantification of IFN-γ spots produced by patient T cells after 18 hr co-culture with T2 cells (n=3) pulsed with 10 μM of the indicated peptides. (one-way ANOVA followed by Dunnett’s correction for multiple comparisons, 95%CI= −9.061 to −0.2724, Effect size Eta Squared=0.773, DF=10, P=0.037) i, Quantification of PD-1, CD40L, and CD137 expression on patient T cells after 18 hr co-culture with autologous PBMCs pulsed with the indicated peptides, measured by flow cytometry. (one-way ANOVA followed by Dunnett’s correction for multiple comparisons, CD137 group: 95%CI= −4.132 to −1.882, Effect size Eta Squared=0.909, DF=8, P=0.0002; CD40L group: 95%CI=−8.569 to −6.158, Effect size Eta Squared=0.984, DF=8, P=2×10⁻⁷; PD-1 group: 95%CI=−8.176 to −4.917, Effect size Eta Squared=0.961, DF=8, P=6×10⁻⁶) Data are representative of three independent experiments. j, Patient CD8+ T cells that specifically bind to HLA-A*02:01-presented QFIDSSWYL peptide proliferate over 21 days during co-culture with irradiated peptide-pulsed T2 cells. Peptide-specific T cells were detected with phycoerythrin (PE)-labeled dextramer staining. Fluorescence minus one (FMO) was used to guide the gating strategy. All data are representative of at least two independent experiments. Means ± s.e.m. are plotted, with sample n representing the number of independently treated samples.
Fig. 4 –
Fig. 4 –. Donor T cells are stimulated by MYB-NFIB-derived and NFIB-MYB-derived peptides.
a, Quantification of IFN-γ spots produced by healthy donor HD2 and HD3 T cells after 18 hr co-culture with T2 cells (n=3) pulsed with 10 μM of the indicated peptides. P value was calculated using one-way ANOVA followed by Dunnett’s correction for multiple comparisons (In HD2 group, DMSO vs. MMYSPICLTQT: 95%CI=−140.40 to −12.26, Effect size Eta Squared=0.846, DF=10, P=0.0203; DMSO vs. SLASPLQPT: 95%CI=−198.4 to −70.26, Effect size Eta Squared=0.846, DF=10, P=0.0004; In HD3 group, DMSO vs. MMYSPICLTQT: 95%CI=−52.86 to −3.142, Effect size Eta Squared=0.638, DF=10, P=0.028). b, IFN-γ ELISpot assay of peptide-specific HD2 T cells (expanded by co-culturing with peptide-pulsed T2 cells for 21 days), stimulated by co-culturing with autologous DCs electroporated with mRNA encoding the MYB-N-terminus or the corresponding MYB-NFIB fusions. c, Quantification of IFN-γ spots shown in (b) (n=3). (one-tailed t-tests, MMYSPICLTQT-specific T cells group: 95%CI=−1.574 to 14.24, Effect size Eta Squared=0.553, P=0.045; SLASPLQSWYL-specific T cells group: 95%CI=−1.996 to 22, Effect size Eta Squared=0.573, P=0.041; SLASPLQPT-specific T cells group: 95%CI= 2.335 to 29.66, Effect size Eta Squared=0.725, P=0.016). d, Quantification of CD137+ CD8+ T cells measured by flow cytometry (n=3). (two-tailed t-tests, MMYSPICLTQT-specific T cells group: 95%CI=6.304 to 16.03, Effect size Eta Squared=0.910, P=0.0031; SLASPLQPT-specific T cells group: 95%CI=3.181 to 9.292, Effect size Eta Squared=0.889, P=0.0048). e, Associations between immune paramaters (immune cell subsets and immune activity) and the presence of a fusion neoantigen across 5825 fusion-positive cancers. Logistic regression assessing the probability of observing a fusion neoantigen was performed, with immune parameters, cancer type, mutation load, and tumor purity as covariates. Two tailed P-values are shown for the immune parameter. f, A decrease in the number of fusion neoantigens during therapy was observed in melanoma patients (n=42) responding to anti-PD-1 treatment (n=9), but not in patients with stable disease (n=14) or progressing disease (n=19). (two-tailed Wilcoxon test, all samples group: Z= −1.709, P=0.088; CR/PR group: Z=−2.345, P=0.019; SD group: Z=−0.99, P=0.32; PD group: Z=−0.071, P=0.94). Means ± s.e.m. are plotted, with sample n representing the number of independently treated samples.

Comment in

Similar articles

Cited by

References

    1. Coulie PG, Van den Eynde BJ, van der Bruggen P & Boon T Tumour antigens recognized by T lymphocytes: at the core of cancer immunotherapy. Nat Rev Cancer 14, 135–146, doi:10.1038/nrc3670 (2014). - DOI - PubMed
    1. Schreiber RD, Old LJ & Smyth MJ Cancer immunoediting: integrating immunity’s roles in cancer suppression and promotion. Science 331, 1565–1570, doi:10.1126/science.1203486 (2011). - DOI - PubMed
    1. Sharma P & Allison JP The future of immune checkpoint therapy. Science 348, 56–61, doi:10.1126/science.aaa8172 (2015). - DOI - PubMed
    1. Rosenberg SA & Restifo NP Adoptive cell transfer as personalized immunotherapy for human cancer. Science 348, 62–68, doi:10.1126/science.aaa4967 (2015). - DOI - PMC - PubMed
    1. Ott PA et al. An immunogenic personal neoantigen vaccine for patients with melanoma. Nature 547, 217–221, doi:10.1038/nature22991 (2017). - DOI - PMC - PubMed

Methods-only References

    1. Dalin MG et al. Multi-dimensional genomic analysis of myoepithelial carcinoma identifies prevalent oncogenic gene fusions. Nat Commun 8, 1197, doi:10.1038/s41467-017-01178-z (2017). - DOI - PMC - PubMed
    1. Lawrence M et al. Software for computing and annotating genomic ranges. PLoS Comput Biol 9, e1003118, doi:10.1371/journal.pcbi.1003118 (2013). - DOI - PMC - PubMed
    1. Senbabaoglu Y et al. Tumor immune microenvironment characterization in clear cell renal cell carcinoma identifies prognostic and immunotherapeutically relevant messenger RNA signatures. Genome Biol 17, 231, doi:10.1186/s13059-016-1092-z (2016). - DOI - PMC - PubMed
    1. Yoshihara K et al. Inferring tumour purity and stromal and immune cell admixture from expression data. Nat Commun 4, 2612, doi:10.1038/ncomms3612 (2013). - DOI - PMC - PubMed
    1. Rooney MS, Shukla SA, Wu CJ, Getz G & Hacohen N Molecular and genetic properties of tumors associated with local immune cytolytic activity. Cell 160, 48–61, doi:10.1016/j.cell.2014.12.033 (2015). - DOI - PMC - PubMed

Publication types

MeSH terms