. 2019 Apr 12:11:310-326.
doi: 10.1016/j.dadm.2019.02.007. eCollection 2019 Dec.

The Meta VCI Map consortium for meta-analyses on strategic lesion locations for vascular cognitive impairment using lesion-symptom mapping: Design and multicenter pilot study

Collaborators, Affiliations

The Meta VCI Map consortium for meta-analyses on strategic lesion locations for vascular cognitive impairment using lesion-symptom mapping: Design and multicenter pilot study

Nick A Weaver et al. Alzheimers Dement (Amst). .

Abstract

Introduction: The Meta VCI Map consortium performs meta-analyses on strategic lesion locations for vascular cognitive impairment using lesion-symptom mapping. Integration of data from different cohorts will increase sample sizes, to improve brain lesion coverage and support comprehensive lesion-symptom mapping studies.

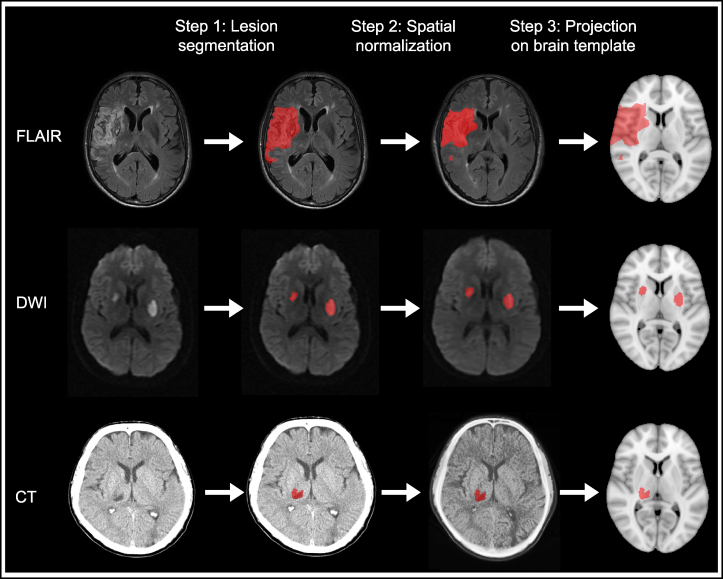
Methods: Cohorts with available imaging on white matter hyperintensities or infarcts and cognitive testing were invited. We performed a pilot study to test the feasibility of multicenter data processing and analysis and determine the benefits to lesion coverage.

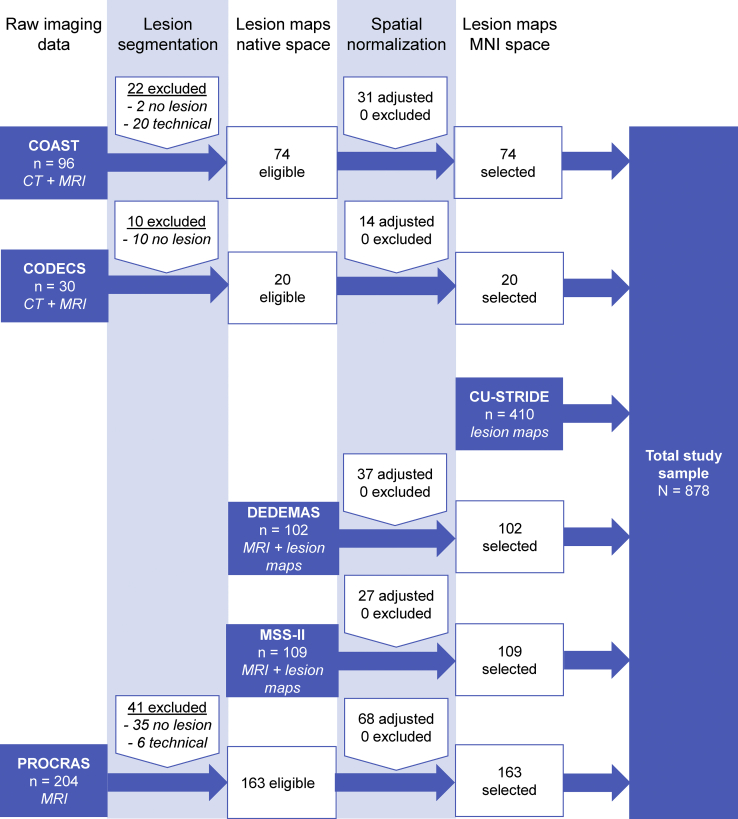
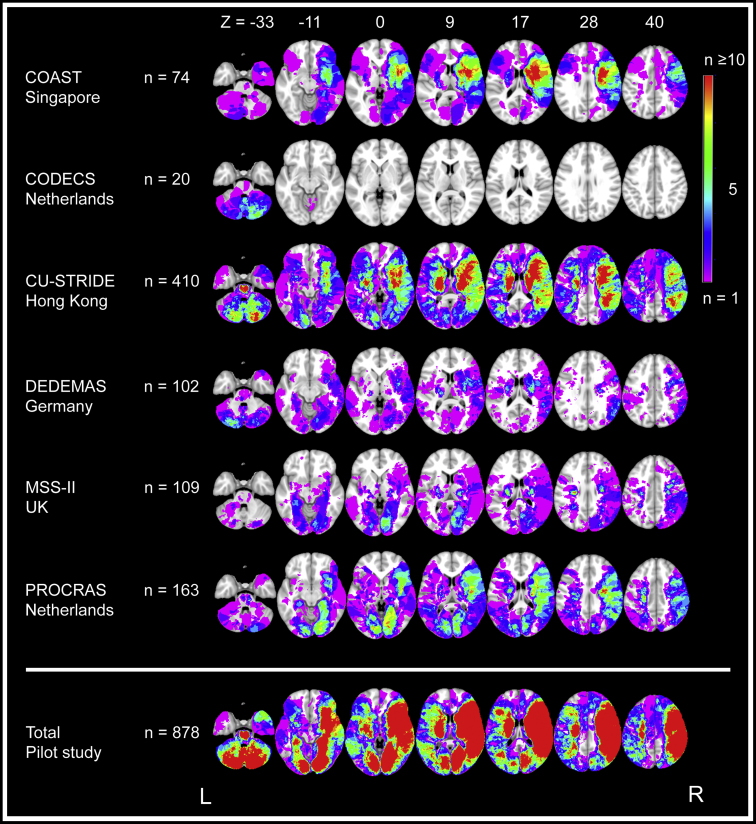
Results: Forty-seven groups have joined Meta VCI Map (stroke n = 7800 patients; memory clinic n = 4900; population-based n = 14,400). The pilot study (six ischemic stroke cohorts, n = 878) demonstrated feasibility of multicenter data integration (computed tomography/magnetic resonance imaging) and achieved marked improvement of lesion coverage.

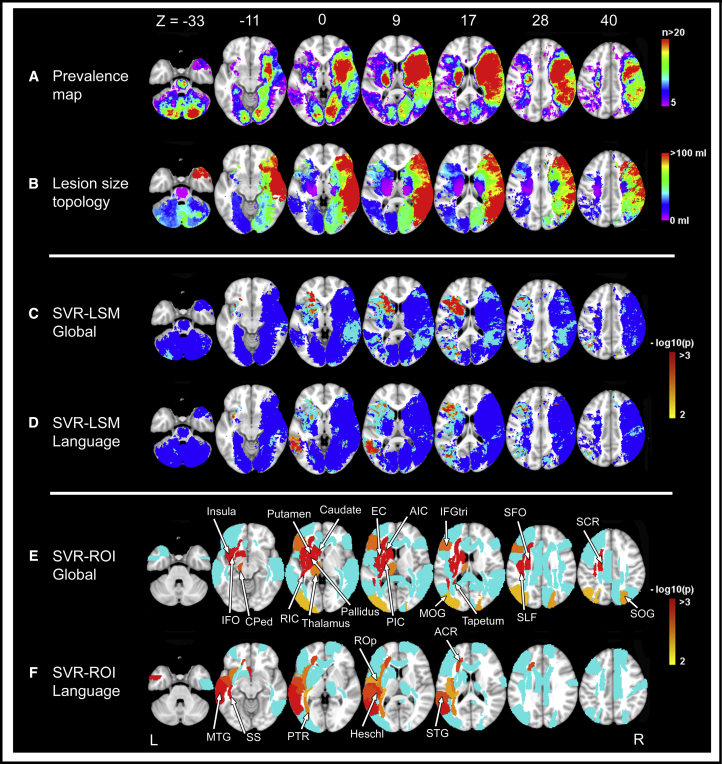
Discussion: Meta VCI Map will provide new insights into the relevance of vascular lesion location for cognitive dysfunction. After the successful pilot study, further projects are being prepared. Other investigators are welcome to join.

Keywords: Cerebrovascular disease; Consortium; Data harmonization; Lesion location; Lesion-symptom mapping; Small vessel disease; Stroke; Support vector regression; Vascular cognitive impairment.


Figures

Fig. 1
Fig. 1
Typical image and lesion processing pipeline for lesion-symptom mapping studies. Lesion-symptom mapping studies essentially require three image and lesion processing steps to prepare lesion maps. Examples are shown for three common imaging sequences: FLAIR, DWI, and CT. First, the lesion must be delineated on the original scan data (lesion segmentation). This can be done manually, or (semi-)automatically using computer algorithms. Next, the scan and corresponding lesion map are transformed to fit the size and shape of a brain template (spatial normalization). An intermediate registration step to an age-specific template is often used to improve registration accuracy. Finally, the resulting lesion map is projected onto the brain template. This result is compared to the original scan, to determine whether lesion registration was successful. Main criteria are that the key anatomical landmarks of the transformed scan and template should correspond and that the registered lesion map accurately represents the original lesion regarding location, size, and shape. The final lesion map can be used for group comparisons, unrestricted by type and format of the raw imaging data. Abbreviations: CT, computed tomography; DWI, diffusion-weighted imaging; FLAIR, fluid attenuated inversion recovery.
Fig. 2
Fig. 2
Flowchart of patient selection for the Meta VCI Map pilot study. Patient selection is shown for each cohort separately. Cohorts could join at any given step of image processing. The processing steps—congruent with the pipeline shown in Fig. 1—are shown at the top. Availability of clinical data was a prerequisite to be considered. The blue boxes indicate at what stage the cohort entered the pipeline, and what kind of imaging data was provided. Note that spatial normalization passed visual quality control in all cases, though (minor) manual adjustments were made in 177 (38%) cases.
Fig. 3
Fig. 3
Lesion prevalence map for individual cohorts and the collective data set of the Meta VCI Map pilot study. Voxel-based lesion prevalence map of infarcts for individual cohorts and collective data set, shown on the Montreal Neurological Institute 152 T1 template . Every voxel that is damaged in one or more subjects in the cohort is shown in colors ranging from purple (n = 1) to red (n ≥ 10). The right hemisphere is depicted on the right, which is conventional in lesion-symptom mapping studies. To prevent that lesion-symptom mapping analyses are biased by voxels that are only rarely affected, a minimum number of patients with a lesion in a particular voxel is commonly set. Although there is no general rule on where to set this threshold, it is typically set in the range of 5 ≤ n ≤ 10 . In this figure, blue- and purple-colored voxels are damaged in less than five subjects and thus would normally be excluded from lesion-symptom mapping studies. The bottom lesion map was created by merging lesion maps from all the cohorts, which shows a considerably increased number of included voxels after integrating the data from all six cohorts. Note that the left hemisphere is relatively underrepresented; most cohorts used aphasia as an exclusion criterion because it precluded reliable cognitive assessment. Thus, subjects with (large) left hemispheric lesions were often excluded during initial inclusion of stroke patients.
Fig. 4
Fig. 4
Lesion prevalence map and lesion-symptom mapping results. Lesion prevalence map (A), lesion size topographies (B), and SVR-LSM and SVR-ROI results (C–F). The right hemisphere is depicted on the right. (A) Lesion prevalence map showing voxels that are damaged in at least five patients is projected on the 1 mm MNI-152 template . The bar indicates the number of patients with a lesion for each voxel. (B) Lesion size topographies for each voxel lesioned in at least five patients. The bar indicates the median lesion volume (in milliliters) per patient, given that the specific voxel is lesioned. This illustrates whether a particular voxel is more often damaged by relatively large infarcts (red) or small infarcts (purple). In the present study, right hemispheric infarcts were often larger and commonly included cortical areas, while infarcts in the thalamus, brain stem, and internal capsule were often small. (C–D) Results of multivariate lesion-symptom mapping. Voxelwise associations between the presence of a lesion and Montreal Cognitive Assessment (MoCA) total score (C) or language domain score (D) were determined using support vector regression (SVR-LSM). This multivariate approach assesses the intervoxel correlations and identifies which voxels have an independent contribution to the outcome measure. These associations are corrected for age, gender, and education. Significant clusters are shown in colors ranging from yellow (P = .01) to red (P < .001). To visualize the voxels that were included in each step of the analyses, voxels associated with cognition in the univariate analyses (without correction for multiple testing), but not in the multivariate analyses, are shown in light blue. Voxels with no univariate association with cognition are shown in dark blue and were not included in the multivariate analysis. Uncolored voxels were not included in any step of the analyses because these were damaged in less than five individuals. (E–F) Results of multivariate region of interest–based analyses using support vector regression (SVR-ROI). The ROIs where the regional infarct volume was statistically associated with the cognitive functions are colored from yellow (P = .01) to red (P < .001). ROIs that were associated with cognition in the univariate analyses but not in the multivariate analyses are shown in light blue. The names of the significant ROIs are labeled in the figure. Abbreviations: ACR, anterior corona radiata; AIC, anterior limb of internal capsule; CPed, cerebral peduncle; EC, external capsule; IFGtri, inferior frontal gyrus (triangular); IFO, inferior fronto-occipital fasciculus; MOG, middle occipital gyrus; MTG, middle temporal gyrus; PIC, posterior limb of internal capsule; PTR, posterior thalamic radiation; RIC, retrolenticular part of internal capsule; ROp, rolandic operculum; SCR, superior corona radiata; SFO, superior fronto-occipital fasciculus; SLF, superior longitudinal fasciculus; SOG, superior occipital gyrus; SS, sagittal striatum; STG, superior temporal gyrus.

References

    1. Gorelick P.B., Scuteri A., Black S.E., Decarli C., Greenberg S.M., Iadecola C. Vascular contributions to cognitive impairment and dementia: A statement for healthcare professionals from the American Heart Association/American Stroke Association. Stroke. 2011;42:2672–2713. - PMC - PubMed
    1. Prins N.D., Scheltens P. White matter hyperintensities, cognitive impairment and dementia: An update. Nat Rev Neurol. 2015;11:157–165. - PubMed
    1. Biesbroek J.M., Weaver N.A., Biessels G.J. Lesion location and cognitive impact of cerebral small vessel disease. Clin Sci. 2017;131:715–728. - PubMed
    1. Rorden C., Karnath H.O. Using human brain lesions to infer function: A relic from a past era in the fMRI age? Nat Rev Neurosci. 2004;5:812–819. - PubMed
    1. Duering M., Zieren N., Hervé D., Jouvent E., Reyes S., Peters N. Strategic role of frontal white matter tracts in vascular cognitive impairment: A voxel-based lesion-symptom mapping study in CADASIL. Brain. 2011;134:2366–2375. - PubMed