

Machine Learning Methods Uncover Radiomorphologic Dose Patterns in Salivary Glands that Predict Xerostomia in Patients with Head and Neck Cancer
- PMID: 31011686
- PMCID: PMC6460328
- DOI: 10.1016/j.adro.2018.11.008
Machine Learning Methods Uncover Radiomorphologic Dose Patterns in Salivary Glands that Predict Xerostomia in Patients with Head and Neck Cancer
Abstract
Purpose: Patients with head-and-neck cancer (HNC) may experience xerostomia after radiation therapy (RT), which leads to compromised quality of life. The purpose of this study is to explore how the spatial pattern of radiation dose (radiomorphology) in the major salivary glands influences xerostomia in patients with HNC.
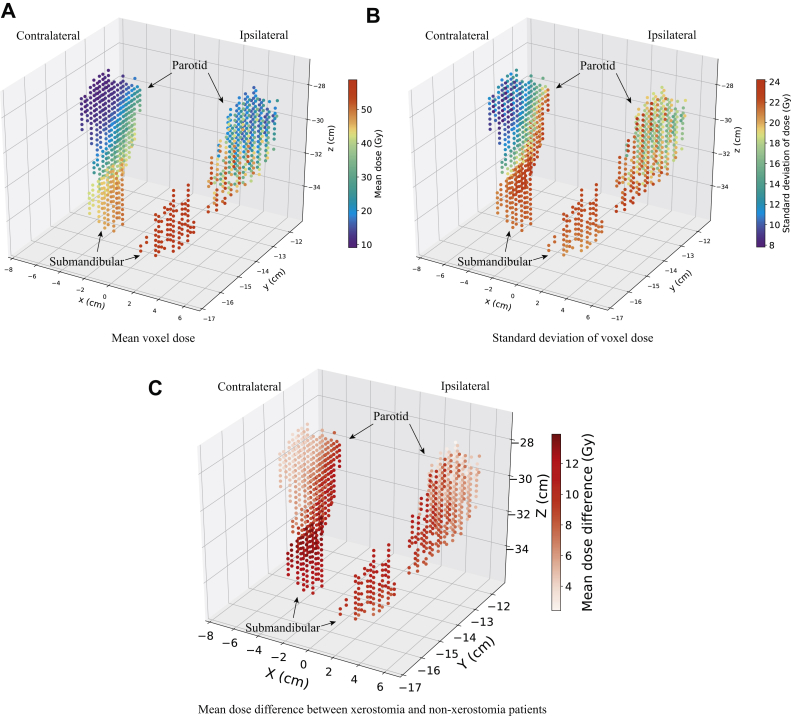
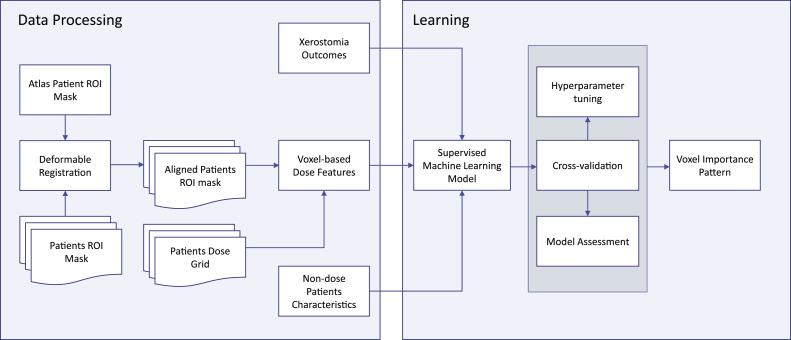
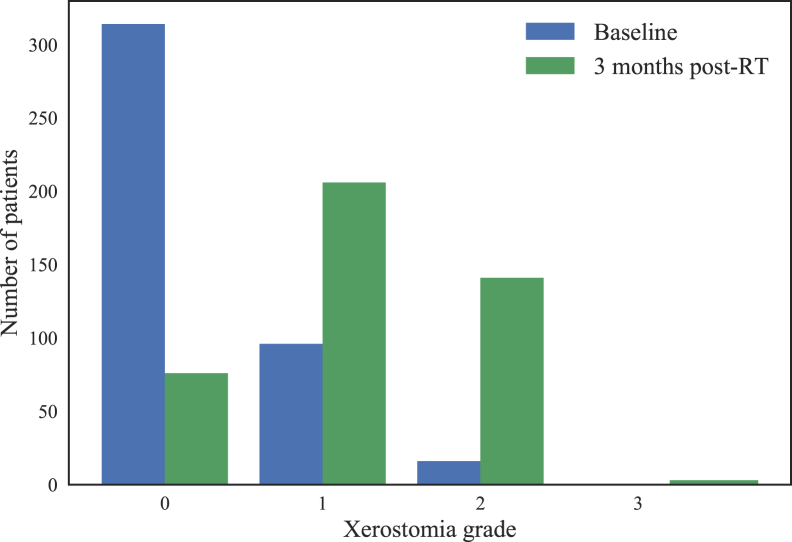
Methods and materials: A data-driven approach using spatially explicit dosimetric predictors, voxel dose (ie, actual radiation dose in voxels in parotid glands [PG] and submandibular glands [SMG]) was used to predict whether patients would develop xerostomia 3 months after RT. Using planned radiation dose data and other nondose covariates including baseline xerostomia grade of 427 patients with HNC in our database, the machine learning methods were used to investigate the influence of dose patterns across subvolumes in PG and SMG on xerostomia.
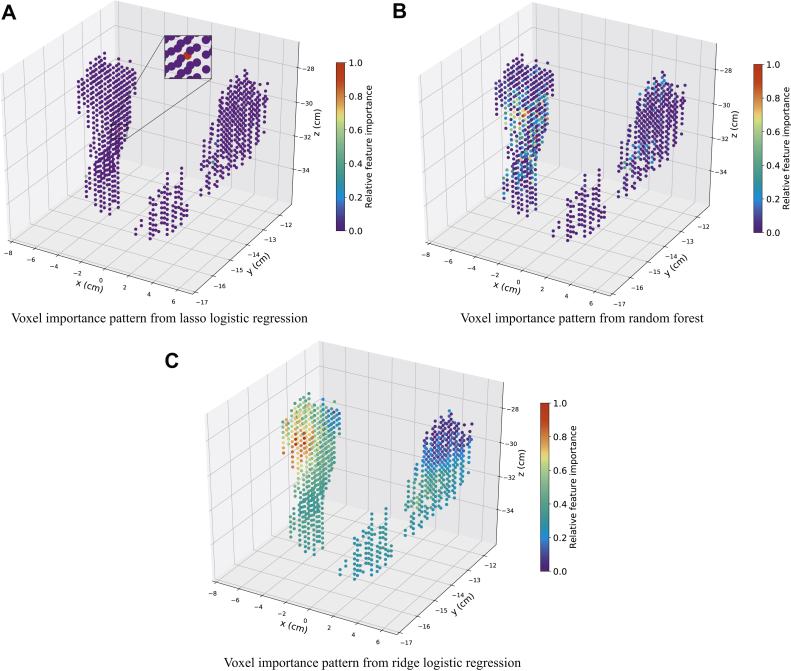
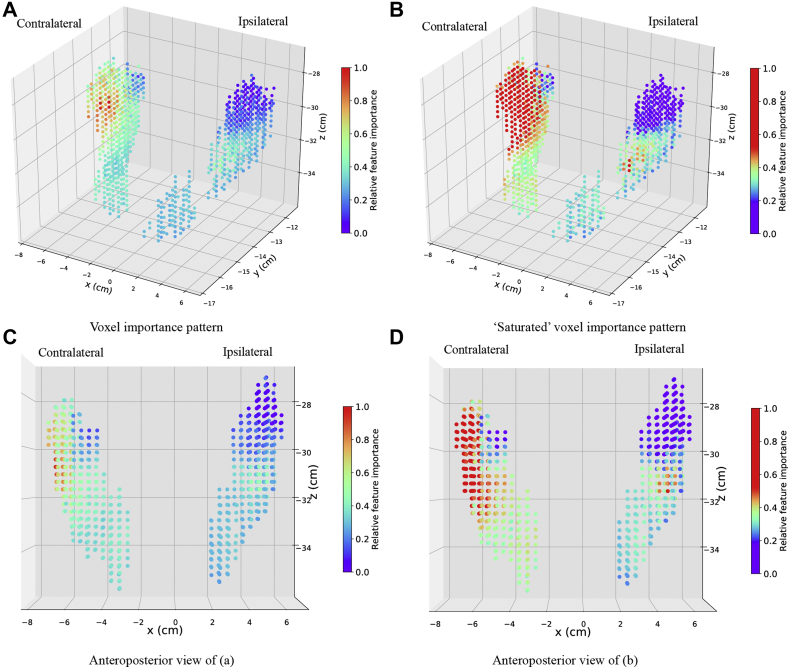
Results: Of the 3 supervised learning methods studied, ridge logistic regression yielded the best predictive performance. Ridge logistic regression was also preferred to evaluate the influence pattern of highly correlated dose on xerostomia, which showed a discriminative pattern of influence of doses in the PG and SMG on xerostomia. Moreover, the superior-anterior portion of the contralateral PG and medial portion of the ipsilateral PG were determined to be the most influential regions regarding dose effect on xerostomia. The area under the receiver operating characteristic curve from a 10-fold cross-validation was 0.70 ± 0.04.
Conclusions: Radiomorphology, combined with machine learning methods, is able to suggest patterns of dose in PG and SMG that are the most influential on xerostomia. The influence pattern identified by this data-driven approach and machine learning methods may help improve RT treatment planning and reduce xerostomia after treatment.
Figures
References
-
- Eisbruch A., Kim H.M., Terrell J.E. Xerostomia and its predictors following parotid-sparing irradiation of head-and-neck cancer. Int J Radiat Oncol Biol Phys. 2001;50:695–704. - PubMed
-
- Dirix P., Nuyts S., Van Den Bogaert W. Radiation-induced xerostomia in patients with head and neck cancer: A literature review. Cancer. 2006;107:2525–2534. - PubMed
-
- Beetz I., Schilstra C., van der Schaaf A. NTCP models for patient-rated xerostomia and sticky saliva after treatment with intensity modulated radiotherapy for head and neck cancer: The role of dosimetric and clinical factors. Radiother Oncol. 2012;105:101–106. - PubMed
LinkOut - more resources
Full Text Sources
