

Environmental potassium regulates bacterial flotation, antibiotic production and turgor pressure in Serratia through the TrkH transporter
- PMID: 31012245
- PMCID: PMC6617781
- DOI: 10.1111/1462-2920.14637
Environmental potassium regulates bacterial flotation, antibiotic production and turgor pressure in Serratia through the TrkH transporter
Abstract
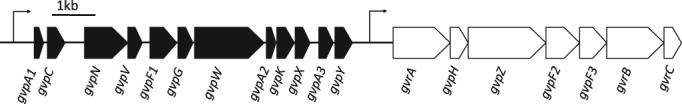
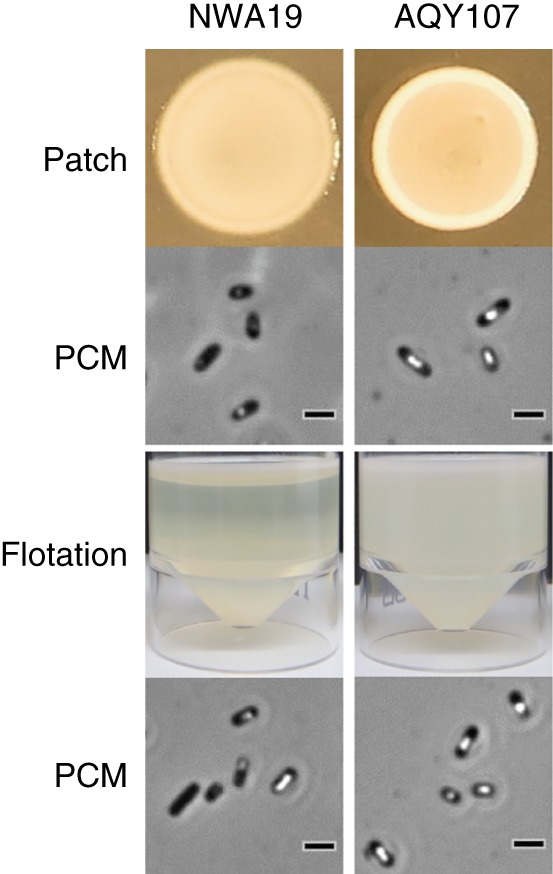
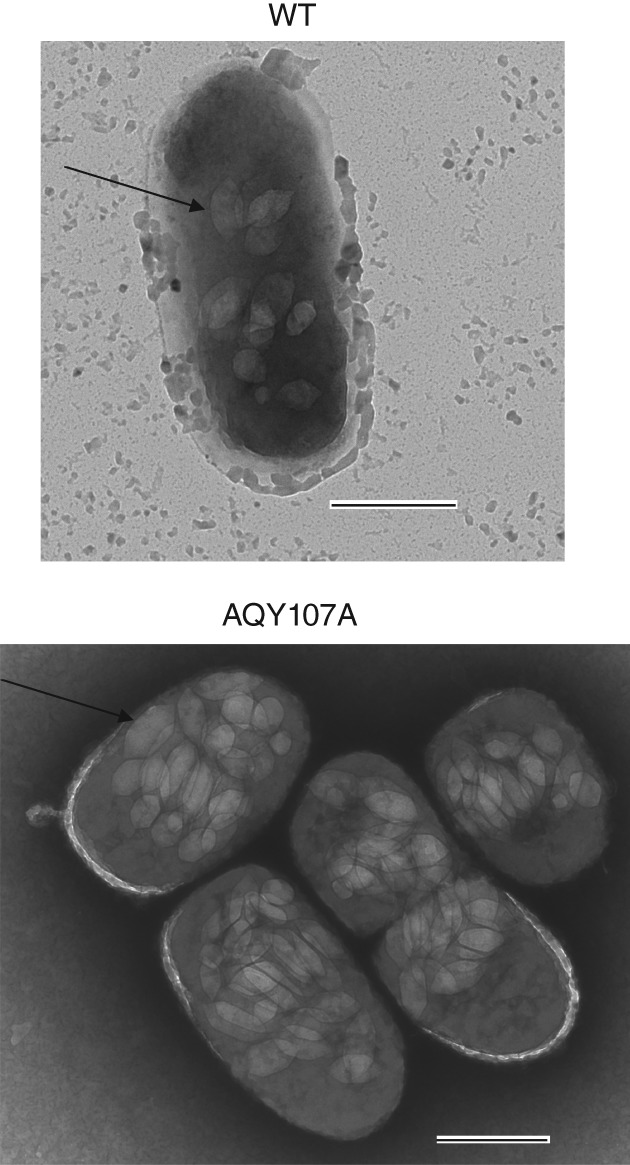
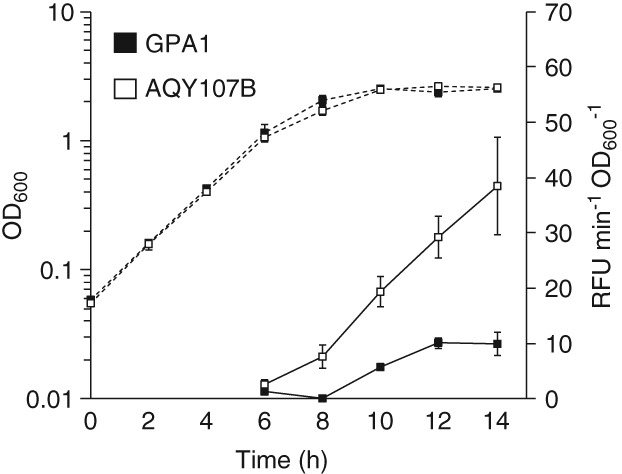
Serratia sp. strain ATCC 39006 (S39006) can float in aqueous environments due to natural production of gas vesicles (GVs). Expression of genes for GV morphogenesis is stimulated in low oxygen conditions, thereby enabling migration to the air-liquid interface. Quorum sensing (via SmaI and SmaR) and transcriptional and post-transcriptional regulators, including RbsR and RsmA, respectively, connect the control of cell buoyancy, motility and secondary metabolism. Here, we define a new pleiotropic regulator found in screens of GV mutants. A mutation in the gene trkH, encoding a potassium transporter, caused upregulation of GV formation, flotation, and the prodigiosin antibiotic, and downregulation of flagellar motility. Pressure nephelometry revealed that the mutation in trkH affected cell turgor pressure. Our results show that osmotic change is an important physiological parameter modulating cell buoyancy and antimicrobial production in S39006, in response to environmental potassium levels.
© 2019 The Authors. Environmental Microbiology published by Society for Applied Microbiology and John Wiley & Sons Ltd.
Conflict of interest statement
The authors do not have any conflict of interest in relation to the work described.
Figures
Similar articles
-
The FloR master regulator controls flotation, virulence and antibiotic production in Serratia sp. ATCC 39006.Environ Microbiol. 2020 Jul;22(7):2921-2938. doi: 10.1111/1462-2920.15048. Epub 2020 Jun 14. Environ Microbiol. 2020. PMID: 32352190
-
RNA-seq reveals the RNA binding proteins, Hfq and RsmA, play various roles in virulence, antibiotic production and genomic flux in Serratia sp. ATCC 39006.BMC Genomics. 2013 Nov 22;14(1):822. doi: 10.1186/1471-2164-14-822. BMC Genomics. 2013. PMID: 24267595 Free PMC article.
-
The RNA chaperone, Hfq, controls two luxR-type regulators and plays a key role in pathogenesis and production of antibiotics in Serratia sp. ATCC 39006.Environ Microbiol. 2011 Oct;13(10):2649-66. doi: 10.1111/j.1462-2920.2011.02532.x. Epub 2011 Aug 8. Environ Microbiol. 2011. PMID: 21824244
-
Quorum sensing in Serratia.FEMS Microbiol Rev. 2007 Jul;31(4):407-24. doi: 10.1111/j.1574-6976.2007.00071.x. Epub 2007 Apr 25. FEMS Microbiol Rev. 2007. PMID: 17459113 Review.
-
N-acylhomoserine lactone-dependent cell-to-cell communication and social behavior in the genus Serratia.Int J Med Microbiol. 2006 Apr;296(2-3):117-24. doi: 10.1016/j.ijmm.2006.01.033. Epub 2006 Feb 17. Int J Med Microbiol. 2006. PMID: 16483841 Review.
Cited by
-
Unappreciated Roles for K+ Channels in Bacterial Physiology.Trends Microbiol. 2021 Oct;29(10):942-950. doi: 10.1016/j.tim.2020.11.005. Epub 2020 Dec 5. Trends Microbiol. 2021. PMID: 33288383 Free PMC article. Review.
-
Regulation of potassium uptake in Caulobacter crescentus.J Bacteriol. 2024 Sep 19;206(9):e0010724. doi: 10.1128/jb.00107-24. Epub 2024 Aug 12. J Bacteriol. 2024. PMID: 39133005 Free PMC article.
-
The IclR-family transcriptional regulator XyrR controls flotation, motility, antibiotic production and virulence in Serratia sp. ATCC 39006.Front Microbiol. 2025 Jan 15;15:1500889. doi: 10.3389/fmicb.2024.1500889. eCollection 2024. Front Microbiol. 2025. PMID: 39881986 Free PMC article.
-
Experimental Evolution of Anticipatory Regulation in Escherichia coli.Front Microbiol. 2022 Jan 11;12:796228. doi: 10.3389/fmicb.2021.796228. eCollection 2021. Front Microbiol. 2022. PMID: 35087497 Free PMC article.
References
-
- Abràmoff, M.D. , Magalhães, P.J. , and Ram, S.J. (2004) Image processing with ImageJ. Biophotonics Intern 11: 36–42.
-
- Allison, E.M. , and Walsby, A.E. (1981) The role of potassium in the control of turgor pressure in a gas‐vacuolate blue‐green alga. J Exp Bot 32: 241–249.
-
- Armitage, J.P. (1997) Behavioural responses of bacteria to light and oxygen. Arch Microbiol 168: 249–261. - PubMed
Publication types
MeSH terms
Substances
Grants and funding
LinkOut - more resources
Full Text Sources
Medical
