. 2019 May;27(5):777-784.
doi: 10.1002/oby.22436.

Mediterranean versus Western Diet Effects on Caloric Intake, Obesity, Metabolism, and Hepatosteatosis in Nonhuman Primates

Affiliations

Mediterranean versus Western Diet Effects on Caloric Intake, Obesity, Metabolism, and Hepatosteatosis in Nonhuman Primates

Carol A Shively et al. Obesity (Silver Spring). 2019 May.

Erratum in

Abstract

Objective: This study aimed to determine the effects of humanlike Western and Mediterranean diets on caloric intake, obesity, metabolism, and hepatosteatosis in an established nonhuman primate model of obesity, cardiometabolic syndrome, type 2 diabetes, and atherosclerosis.

Methods: A 38-month, randomized, preclinical, nonhuman primate primary prevention trial of 38 socially housed, middle-aged adult females was conducted. The monkeys were characterized during a 7-month baseline phase while consuming chow and then randomized to either Western or Mediterranean diets; the groups were balanced on baseline characteristics. Western and Mediterranean diets were formulated to closely reflect human diets, matched on macronutrient content, with protein and fat derived largely from animal sources in the Western diet and plant sources in the Mediterranean diet. Food consumption, activity levels, energy expenditure, body composition, carbohydrate metabolism, and hepatosteatosis were measured during baseline and treatment phases.

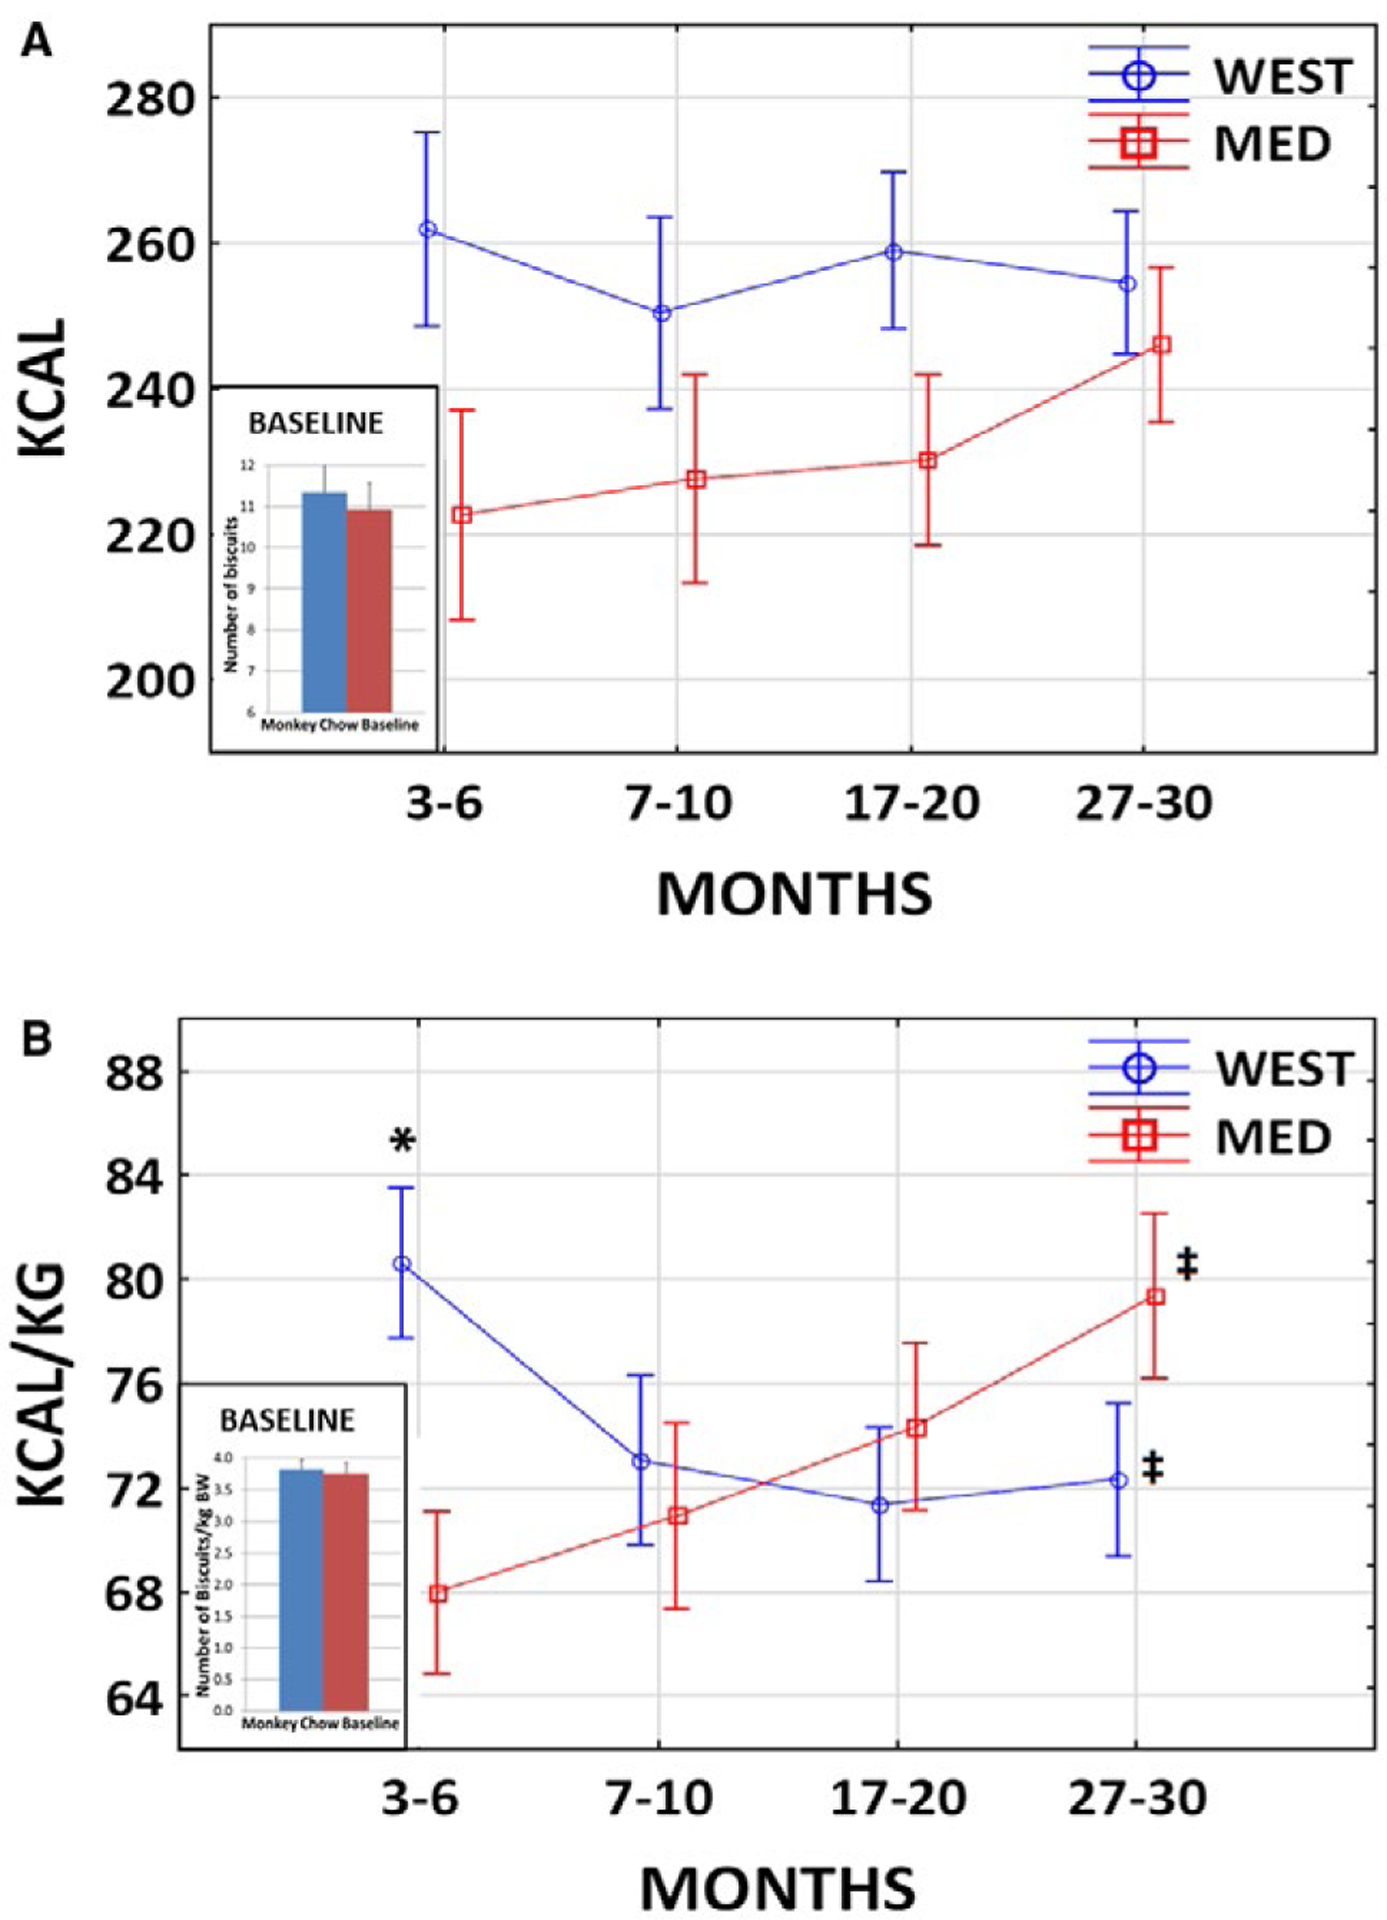
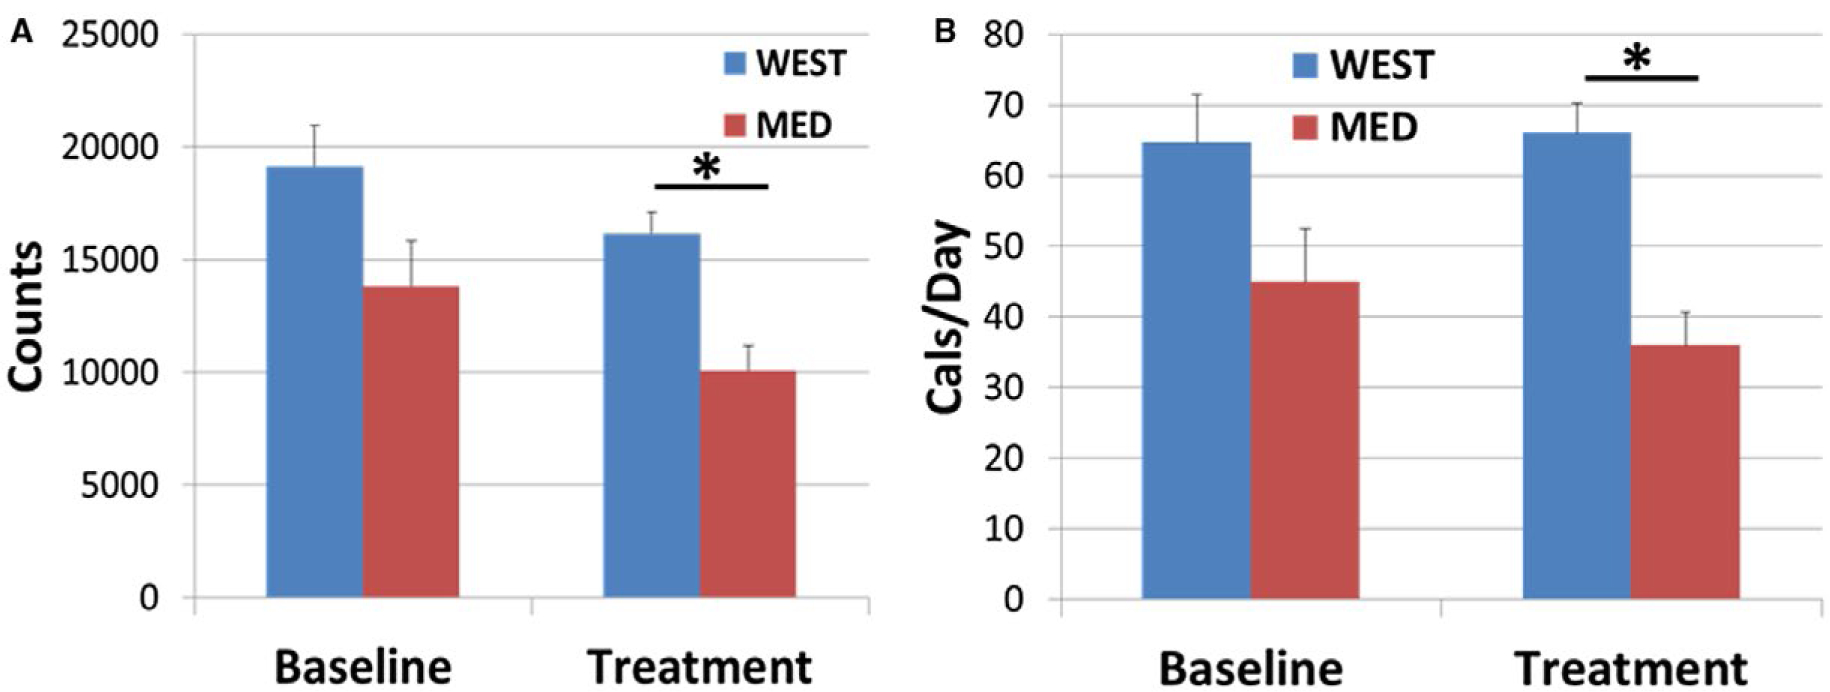
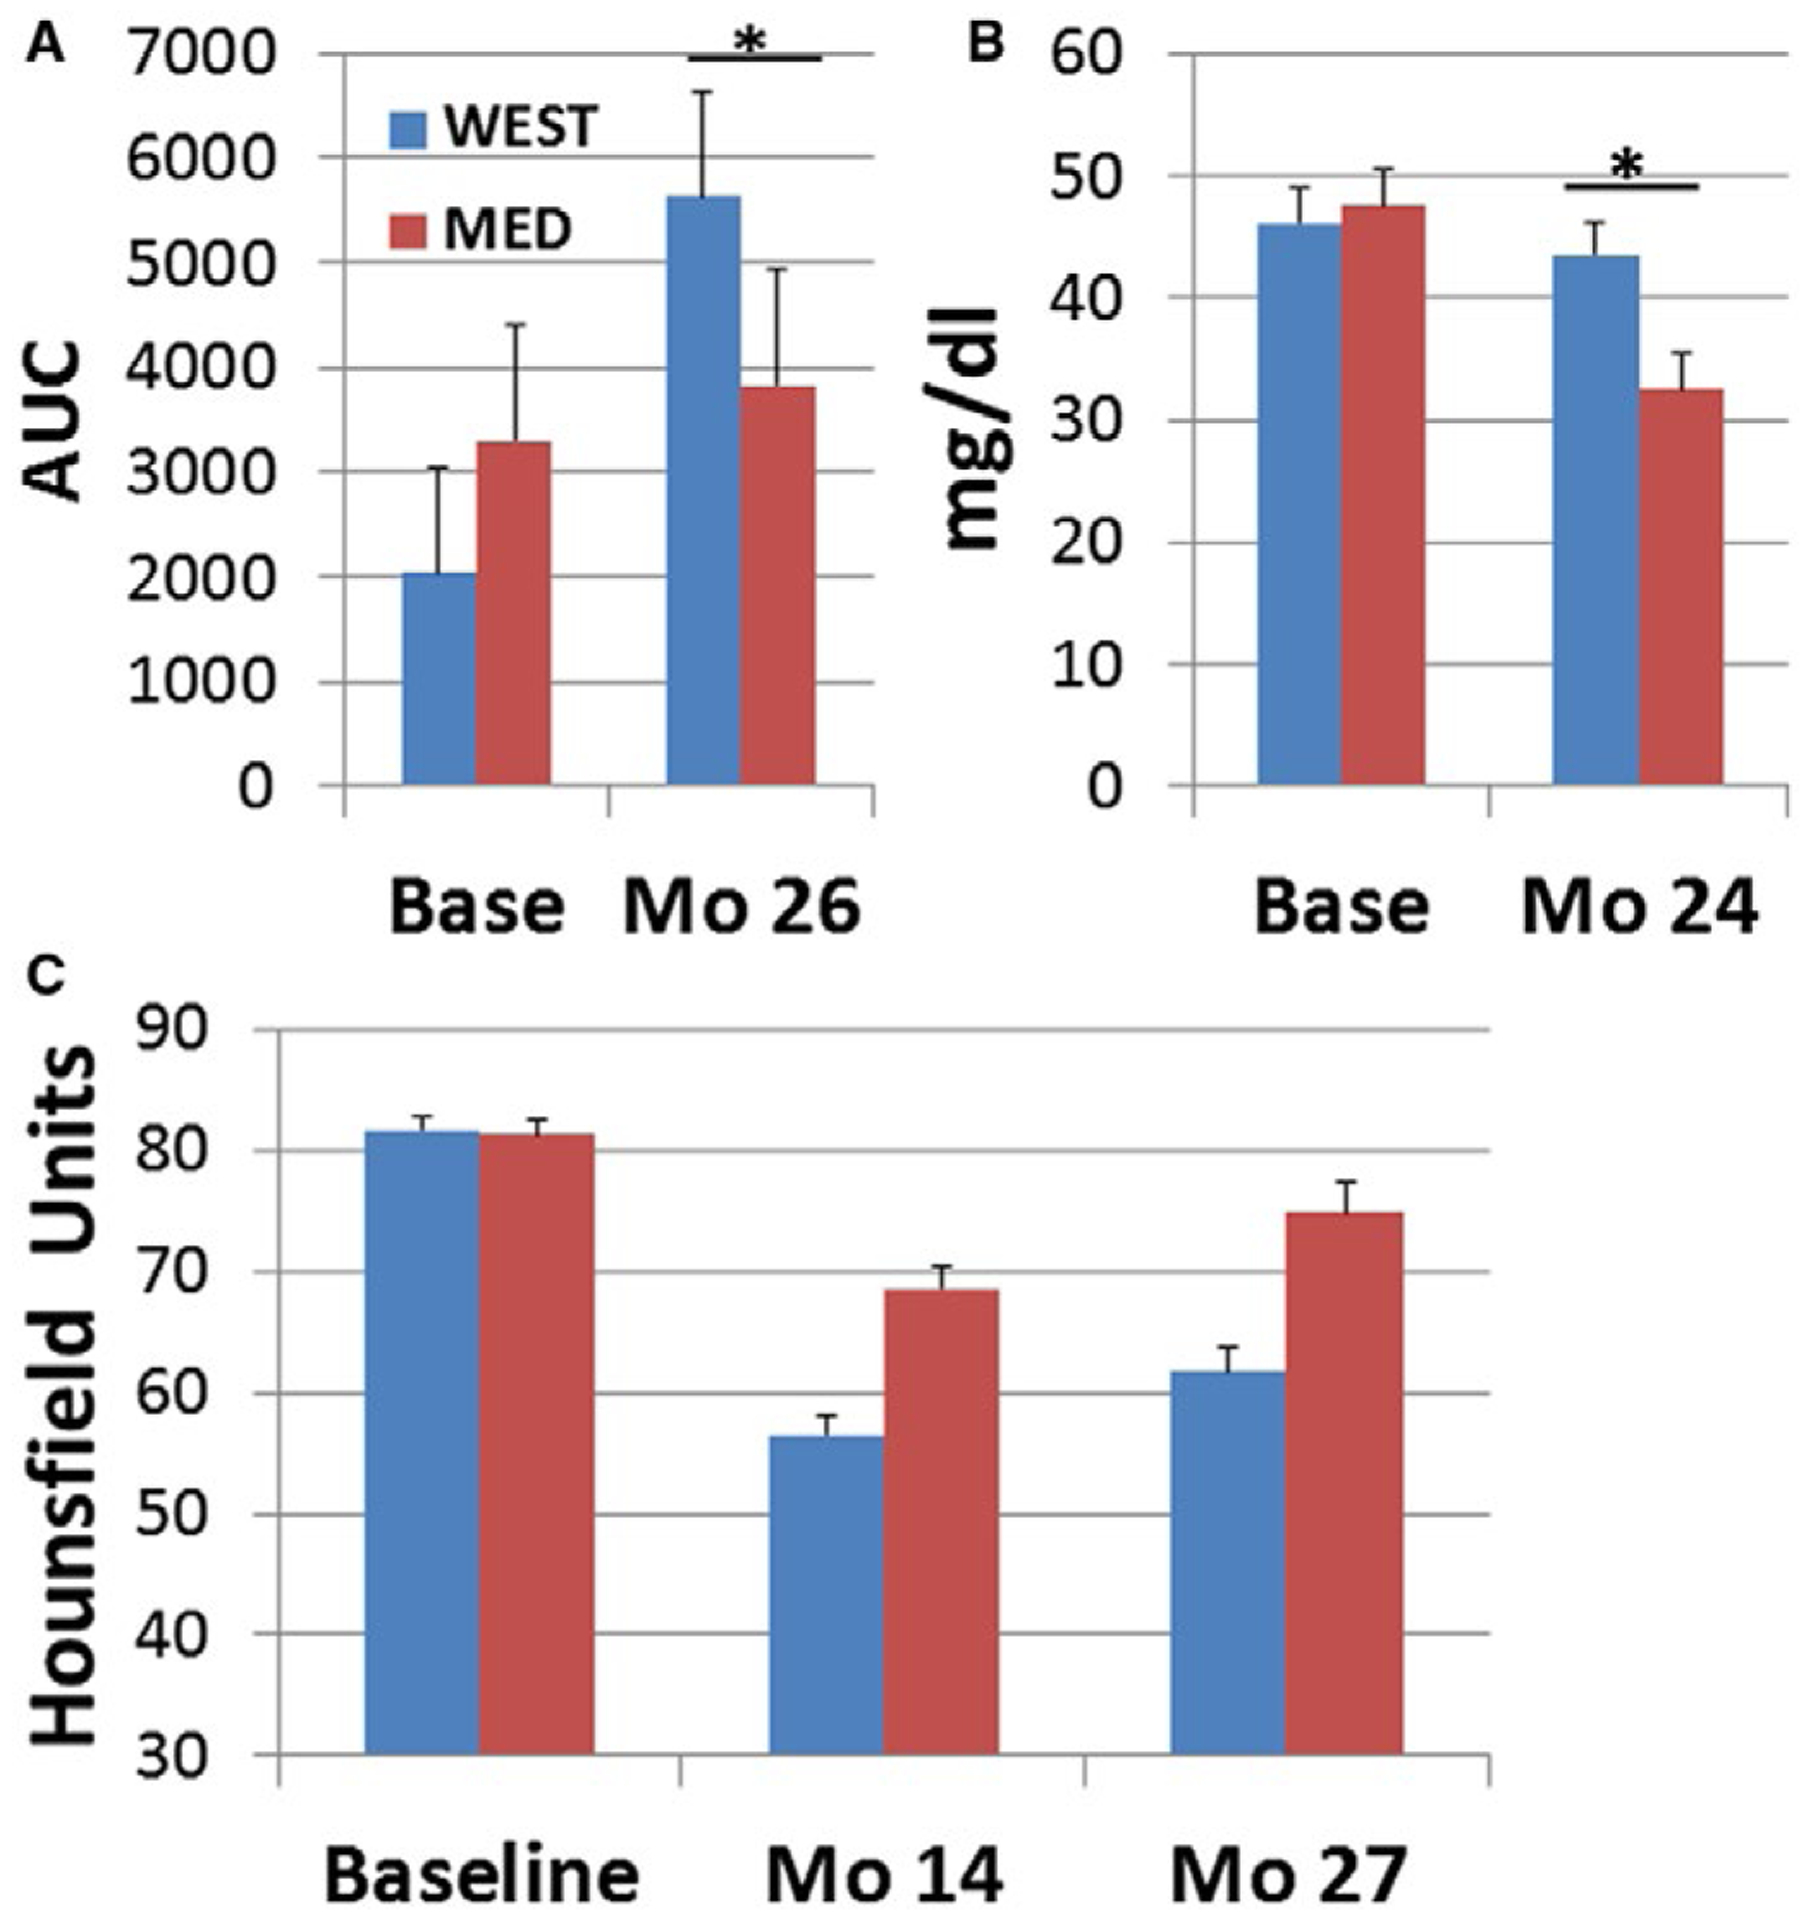
Results: The Western diet increased caloric intake for the first 6 months and body fat, activity, energy expenditure, insulin resistance, and hepatosteatosis after 2.5 years, whereas the Mediterranean diet reduced triglyceride levels.

Conclusions: This is the first report of differential caloric intake and obesity with long-term consumption of a Western versus Mediterranean diet under controlled experimental conditions and the first experimental evidence that a Mediterranean diet protects against hepatosteatosis compared with a Western diet.


Conflict of interest statement

Disclosure: The authors declared no conflict of interest.

Figures

Figure 1
Figure 1. Body composition and adiposity.
(A) Body composition: BMI did not differ between treatment groups during the baseline phase (t[36] = 0.02; P = 0.98). There was a significant difference in BMI between treatment groups during months 6 to 31 (2 × 6 ANCOVA F[1,35] = 9.66; P = 0.004). (B) Body fat determined by CT did not differ between treatment groups during the baseline phase (t[36] = 0.52; P = 0.60). After the baseline phase, there was a significant difference in amount of fat between treatment groups (2 × 2 ANCOVA, main effect of diet: F[1,35] = 4.47; P = 0.04). Changes over the 6- to 31-month time period (F[1,35] = 0.001; P = 0.98) and the treatment group × time interaction (F[1,35] = 0.02; P = 0.89) were not significant. [Colour figure can be viewed at wileyonlinelibrary.com]
Figure 2
Figure 2
Food consumption. (A) Calories consumed. There was no significant difference in chow intake (number of biscuits) between the two treatment groups during the baseline phase (t[36] = 0.47; P = 0.64; inset). Overall, there was no significant difference in calories consumed between treatment groups (2 × 4 ANCOVA F[1,34] = 2.65; P = 0.11) or over time (F[4,136] = 1.51; P = 0.22), and there was no significant diet × time interaction (F[3,102] = 41.66; P = 0.18). (B) Calories per kilogram body weight (BW). There was no significant difference in number of biscuits consumed per kilogram BW between the two treatment groups during the baseline phase (t[36] = 0.32; P = 0.75; inset). There was no significant difference in calories per kilogram BW consumed between treatment groups (2 × 4 ANCOVA F[1,34] = 0.11; P = 0.74) or over time (F[3,102] = 0.68; P = 0.56). There was a significant diet × time interaction (F[3,102] = 7.49; P = 0.0001). Post hoc tests revealed that the WEST group consumed more than the MED group at 3 to 6 months (*P = 0.01) but not at any other time point thereafter (all Ps > 0.17). Those in the WEST group consumed significantly less per kilogram BW at 27 to 30 months compared with 3 to 6 months (P = 0.02), whereas those in the MED group consumed significantly more per kilogram BW at 27 to 30 months compared with 3 to 6 months (P = 0.001). [Colour figure can be viewed at wileyonlinelibrary.com]
Figure 3
Figure 3
Activity levels and energy expenditure. (A) On average, activity levels at baseline were lower in the MED group, although the difference did not reach significance (t[36] = 1.98; P = 0.055). Overall, there was a significant difference between treatment groups in activity levels during the treatment phase (2 × 2 ANCOVA, main effect of diet: F[1,35] = 4.19; *P = 0.048). Treatment phase means were adjusted for baseline. (B) On average, energy expenditure at baseline was lower in the MED group, although the difference did not reach significance (t[36] = 1.85; P = 0.073). Overall, there was a significant difference between treatment groups in energy expenditure during the treatment phase (2 × 2 ANCOVA, main effect of diet: F[1,35] = 4.16; *P = 0.049). Treatment means were adjusted for baseline. [Colour figure can be viewed at wileyonlinelibrary.com]
Figure 4
Figure 4
Insulin, triglycerides, and hepatosteatosis. (A) Insulin responses to glucose challenge. There was no significant difference in the insulin AUC at baseline (t[36] = 1.35; P = 0.18). Insulin AUC after 26 months of treatment was higher in the WEST group (1 × 2 ANCOVA, main effect of diet: F[1,35] = 4.16; *P = 0.049). Means were adjusted for baseline. (B) There was no difference in baseline triglyceride concentrations (t[36] = 0.25; P = 0.81). Triglyceride concentrations after 24 months of treatment were higher in the WEST group (1 × 2 ANOVA, main effect of diet: F[1,35] = 7.49; *P = 0.01); (C) Hepatosteatosis. Liver attenuation was not significantly different between groups at baseline (t[36] = 0.33; P = 0.74). Liver attenuation during the treatment phase was lower in the WEST than the MED group, indicating increased fat deposition (2 × 2 ANOVA, main effect of diet: F[1,35] = 21.19; P < 0.0001). Liver attenuation also increased, indicating a decrease in fat deposition between 14 and 27 months (main effect of time: F[1,35] = 31.41; P < 0.00001). [Colour figure can be viewed at wileyonlinelibrary.com]

Comment in

  • Is There an Ideal Diet?
    Bray GA, Champagne CM. Bray GA, et al. Obesity (Silver Spring). 2019 May;27(5):690. doi: 10.1002/oby.22473. Obesity (Silver Spring). 2019. PMID: 31012291 No abstract available.
  • Two Bad Diets for Monkeys.
    Zinöcker MK, Lindseth IA. Zinöcker MK, et al. Obesity (Silver Spring). 2019 Oct;27(10):1553. doi: 10.1002/oby.22588. Epub 2019 Aug 14. Obesity (Silver Spring). 2019. PMID: 31411382 No abstract available.
  • Response to "Two Bad Diets for Monkeys".
    Shively CA, Appt SE, Vitolins MZ, Uberseder B, Michalson KT, Silverstein-Metzler MG, Register TC. Shively CA, et al. Obesity (Silver Spring). 2019 Oct;27(10):1554. doi: 10.1002/oby.22587. Epub 2019 Aug 17. Obesity (Silver Spring). 2019. PMID: 31420940 No abstract available.

References

    1. Stice E, Durant S. Elevated objectively measured but not self-reported energy intake predicts future weight gain in adolescents. Appetite 2014;81:84–88. - PMC - PubMed
    1. Suchanek P, Poledne R, Hubacek JA. Dietary intake reports fidelity–fact or fiction? Neuro Endocrinol Lett 2011;32(suppl 2):29–31. - PubMed
    1. U.S. Department of Agriculture, Agricultural Research Service. Energy intakes: percentages of energy from protein, carbohydrate, fat, and alcohol, by gender and age. What We Eat in America, NHANES 2013–2014. https://www.ars.usda.gov/ARSUserFiles/80400530/pdf/1314/Table_5_EIN_GEN_.... Published 2016. Accessed April 6, 2018.
    1. Loh MY, Flatt WP, Martin RJ, Hausman DB. Dietary fat type and level influence adiposity development in obese but not lean Zucker rats. Proc Soc Exp Biol Med 1998;218:38–44. - PubMed
    1. Estruch R, Ros E, Salas-Salvado J, et al. Primary prevention of cardiovascular disease with a Mediterranean diet. N Engl J Med 2013;368:1279–1290. - PubMed

Publication types