Trends in Sedentary Behavior Among the US Population, 2001-2016
- PMID: 31012934
- PMCID: PMC6487546
- DOI: 10.1001/jama.2019.3636
Trends in Sedentary Behavior Among the US Population, 2001-2016
Abstract
Importance: Prolonged sitting, particularly watching television or videos, has been associated with increased risk of multiple diseases and mortality. However, changes in sedentary behaviors over time have not been well described in the United States.
Objective: To evaluate patterns and temporal trends in sedentary behaviors and sociodemographic and lifestyle correlates in the US population.
Design, setting, and participants: A serial, cross-sectional analysis of the US nationally representative data from the National Health and Nutrition Examination Survey (NHANES) among children aged 5 through 11 years (2001-2016); adolescents, 12 through 19 years (2003-2016); and adults, 20 years or older (2003-2016).
Exposures: Survey cycle.
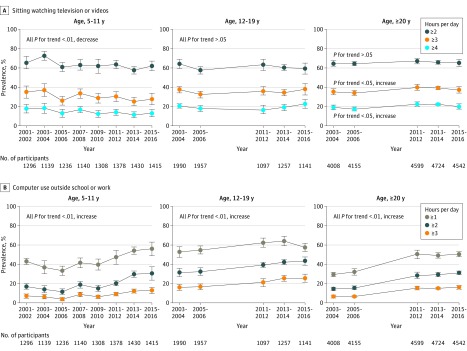
Main outcomes and measures: Prevalence of sitting watching television or videos for 2 h/d or more, computer use outside work or school for 1 h/d or more, and total sitting time (h/d in those aged ≥12 years).
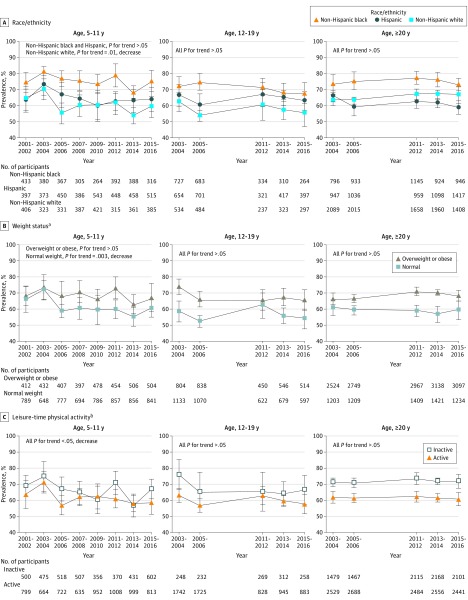
Results: Data on 51 896 individuals (mean, 37.2 years [SE, 0.19]; 25 968 [50%] female) were analyzed from 2001-2016 NHANES data, including 10 359 children, 9639 adolescents, and 31 898 adults. The estimated prevalence of sitting watching television or videos for 2 h/d or more was high among all ages (children, 62% [95% CI, 57% to 67%]; adolescents, 59% [95% CI, 54% to 65%]; adults, 65% [95% CI, 61% to 69%]; adults aged 20-64 years, 62% [95% CI, 58% to 66%]; and ≥65 years, 84% [95% CI, 81% to 88%] in the 2015-2016 cycle). From 2001 through 2016, the trends decreased among children over time (difference, -3.4% [95% CI, -11% to 4.5%]; P for trend =.004), driven by non-Hispanic white children; were stable among adolescents (-4.8% [95% CI, -12% to 2.3%]; P for trend =.60) and among adults aged 20 through 64 years (-0.7% [95% CI, -5.6% to 4.1%]; P for trend =.82); but increased among adults aged 65 years or older (difference, 3.5% [95% CI, -1.2% to 8.1%]; P for trend =.03). The estimated prevalence of computer use outside school or work for 1 h/d or more increased in all ages (children, 43% [95% CI, 40% to 46%] to 56% [95% CI, 49% to 63%] from 2001 to 2016; difference, 13% [95% CI, 5.6% to 21%]; P for trend <.001; adolescents, 53% [95% CI, 47% to 58%] to 57% [95% CI, 53% to 62%] from 2003 to 2016, difference, 4.8% [95% CI, -1.8% to 11%]; P for trend =.002; adults, 29% [27% to 32%] to 50% [48% to 53%] from 2003 to 2016, difference, 21% [95% CI, 18% to 25%]; P for trend <.001). From 2007 to 2016, total hours per day of sitting time increased among adolescents (7.0 [95% CI, 6.7 to 7.4] to 8.2 [95% CI, 7.9 to 8.4], difference, 1.1 [95% CI, 0.7 to 1.5]) and adults (5.5 [95% CI, 5.2 to 5.7] to 6.4 [95% CI, 6.2 to 6.6]; difference, 1.0 [95% CI, 0.7 to 1.3]; P for trend <.001 for both).
Conclusions and relevance: In this nationally representative survey of the US population from 2001 through 2016, the estimated prevalence of sitting watching television or videos for at least 2 hours per day generally remained high and stable. The estimated prevalence of computer use during leisure-time increased among all age groups, and the estimated total sitting time increased among adolescents and adults.
Conflict of interest statement
Figures