The autonomic nervous system regulates pancreatic β-cell proliferation in adult male rats
- PMID: 31013146
- PMCID: PMC6732465
- DOI: 10.1152/ajpendo.00385.2018
The autonomic nervous system regulates pancreatic β-cell proliferation in adult male rats
Abstract
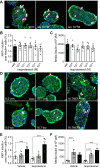
The pancreatic β-cell responds to changes in the nutrient environment to maintain glucose homeostasis by adapting its function and mass. Nutrients can act directly on the β-cell and also indirectly through the brain via autonomic nerves innervating islets. Despite the importance of the brain-islet axis in insulin secretion, relatively little is known regarding its involvement in β-cell proliferation. We previously demonstrated that prolonged infusions of nutrients in rats provoke a dramatic increase in β-cell proliferation in part because of the direct action of nutrients. Here, we addressed the contribution of the autonomic nervous system. In isolated islets, muscarinic stimulation increased, whereas adrenergic stimulation decreased, glucose-induced β-cell proliferation. Blocking α-adrenergic receptors reversed the effect of epinephrine on glucose + nonesterified fatty acids (NEFA)-induced β-cell proliferation, whereas activation of β-adrenergic receptors was without effect. Infusion of glucose + NEFA toward the brain stimulated β-cell proliferation, and this effect was abrogated following celiac vagotomy. The increase in β-cell proliferation following peripheral infusions of glucose + NEFA was not inhibited by vagotomy or atropine treatment but was blocked by coinfusion of epinephrine. We conclude that β-cell proliferation is stimulated by parasympathetic and inhibited by sympathetic signals. Whereas glucose + NEFA in the brain stimulates β-cell proliferation through the vagus nerve, β-cell proliferation in response to systemic nutrient excess does not involve parasympathetic signals but may be associated with decreased sympathetic tone.
Keywords: autonomic nervous system; nutrients; parasympathetic; sympathetic; β-cell proliferation.
Conflict of interest statement
No conflicts of interest, financial or otherwise, are declared by the authors.
Figures


Similar articles
-
Glucose and fatty acids synergistically and reversibly promote beta cell proliferation in rats.Diabetologia. 2017 May;60(5):879-888. doi: 10.1007/s00125-016-4197-8. Epub 2017 Jan 11. Diabetologia. 2017. PMID: 28078385 Free PMC article.
-
Increased pancreatic islet blood flow in 48-hour glucose-infused rats: involvement of central and autonomic nervous systems.Endocrinology. 1997 May;138(5):1836-40. doi: 10.1210/endo.138.5.5094. Endocrinology. 1997. PMID: 9112376
-
Involvement of the autonomic nervous system in the in vivo memory to glucose of pancreatic beta cell in rats.J Clin Invest. 1994 Oct;94(4):1456-62. doi: 10.1172/JCI117483. J Clin Invest. 1994. PMID: 7929821 Free PMC article.
-
Autonomic control of pancreatic beta cells: What is known on the regulation of insulin secretion and beta-cell proliferation in rodents and humans.Peptides. 2022 Feb;148:170709. doi: 10.1016/j.peptides.2021.170709. Epub 2021 Dec 9. Peptides. 2022. PMID: 34896576 Review.
-
Hypothalamic food intake regulating areas are involved in the homeostasis of blood glucose and plasma FFA levels.Physiol Behav. 1988;44(4-5):581-9. doi: 10.1016/0031-9384(88)90322-8. Physiol Behav. 1988. PMID: 3070585 Review.
Cited by
-
Quercetin prevents insulin dysfunction in hypertensive animals.J Diabetes Metab Disord. 2022 Feb 28;21(1):407-417. doi: 10.1007/s40200-022-00987-4. eCollection 2022 Jun. J Diabetes Metab Disord. 2022. PMID: 35673430 Free PMC article.
-
The Vagal Nerve, Inflammation, and Diabetes-A Holy Triangle.Cells. 2023 Jun 15;12(12):1632. doi: 10.3390/cells12121632. Cells. 2023. PMID: 37371102 Free PMC article. Review.
-
Electroacupuncture at ST25 mediated glial cells pruning of pancreatic TRPV1 neural synapse responds to neuropathy-associated beta cell dysfunction.Chin Med. 2025 May 16;20(1):65. doi: 10.1186/s13020-025-01099-w. Chin Med. 2025. PMID: 40380290 Free PMC article.
-
Homocysteine Metabolism Pathway Is Involved in the Control of Glucose Homeostasis: A Cystathionine Beta Synthase Deficiency Study in Mouse.Cells. 2022 May 25;11(11):1737. doi: 10.3390/cells11111737. Cells. 2022. PMID: 35681432 Free PMC article.
-
Central Nervous System Control of Glucose Homeostasis: A Therapeutic Target for Type 2 Diabetes?Annu Rev Pharmacol Toxicol. 2022 Jan 6;62:55-84. doi: 10.1146/annurev-pharmtox-052220-010446. Annu Rev Pharmacol Toxicol. 2022. PMID: 34990204 Free PMC article. Review.
References
-
- Berger M, Scheel DW, Macias H, Miyatsuka T, Kim H, Hoang P, Ku GM, Honig G, Liou A, Tang Y, Regard JB, Sharifnia P, Yu L, Wang J, Coughlin SR, Conklin BR, Deneris ES, Tecott LH, German MS. Gαi/o-coupled receptor signaling restricts pancreatic β-cell expansion. Proc Natl Acad Sci USA 112: 2888–2893, 2015. doi:10.1073/pnas.1319378112. - DOI - PMC - PubMed
Publication types
MeSH terms
Substances
Grants and funding
LinkOut - more resources
Full Text Sources

