Repetitive hypoglycemia reduces activation of glucose-responsive neurons in C1 and C3 medullary brain regions to subsequent hypoglycemia
- PMID: 31013147
- PMCID: PMC6732467
- DOI: 10.1152/ajpendo.00051.2019
Repetitive hypoglycemia reduces activation of glucose-responsive neurons in C1 and C3 medullary brain regions to subsequent hypoglycemia
Abstract
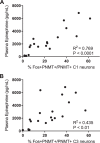
The impaired ability of the autonomic nervous system to respond to hypoglycemia is termed "hypoglycemia-associated autonomic failure" (HAAF). This life-threatening phenomenon results from at least two recent episodes of hypoglycemia, but the pathology underpinning HAAF remains largely unknown. Although naloxone appears to improve hypoglycemia counterregulation under controlled conditions, hypoglycemia prevention remains the current mainstay therapy for HAAF. Epinephrine-synthesizing neurons in the rostroventrolateral (C1) and dorsomedial (C3) medulla project to the subset of sympathetic preganglionic neurons that regulate peripheral epinephrine release. Here we determined whether or not C1 and C3 neuronal activation is impaired in HAAF and whether or not 1 wk of hypoglycemia prevention or treatment with naloxone could restore C1 and C3 neuronal activation and improve HAAF. Twenty male Sprague-Dawley rats (250-300 g) were used. Plasma epinephrine levels were significantly increased after a single episode of hypoglycemia (n = 4; 5,438 ± 783 pg/ml vs. control 193 ± 27 pg/ml, P < 0.05). Repeated hypoglycemia significantly reduced the plasma epinephrine response to subsequent hypoglycemia (n = 4; 2,179 ± 220 pg/ml vs. 5,438 ± 783 pg/ml, P < 0.05). Activation of medullary C1 (n = 4; 50 ± 5% vs. control 3 ± 1%, P < 0.05) and C3 (n = 4; 45 ± 5% vs. control 4 ± 1%, P < 0.05) neurons was significantly increased after a single episode of hypoglycemia. Activation of C1 (n = 4; 12 ± 3%, P < 0.05) and C3 (n = 4; 19 ± 5%, P < 0.05) neurons was significantly reduced in the HAAF groups. Hypoglycemia prevention or treatment with naloxone did not restore the plasma epinephrine response or C1 and C3 neuronal activation. Thus repeated hypoglycemia reduced the activation of C1 and C3 neurons mediating adrenal medullary responses to subsequent bouts of hypoglycemia.
Keywords: HAAF; catecholaminergic neurons; dorsomedial medulla; epinephrine; ventrolateral medulla.
Conflict of interest statement
No conflicts of interest, financial or otherwise, are declared by the authors.
Figures


Similar articles
-
Plasma Epinephrine Contributes to the Development of Experimental Hypoglycemia-Associated Autonomic Failure.J Clin Endocrinol Metab. 2020 Nov 1;105(11):3416-27. doi: 10.1210/clinem/dgaa539. J Clin Endocrinol Metab. 2020. PMID: 32915987 Free PMC article.
-
Hypoglycemia-associated autonomic failure is prevented by opioid receptor blockade.J Clin Endocrinol Metab. 2009 Sep;94(9):3372-80. doi: 10.1210/jc.2009-0882. Epub 2009 Jun 30. J Clin Endocrinol Metab. 2009. PMID: 19567512 Free PMC article.
-
Partial blockade of nicotinic acetylcholine receptors improves the counterregulatory response to hypoglycemia in recurrently hypoglycemic rats.Am J Physiol Endocrinol Metab. 2014 Oct 1;307(7):E580-8. doi: 10.1152/ajpendo.00237.2014. Epub 2014 Aug 12. Am J Physiol Endocrinol Metab. 2014. PMID: 25117409 Free PMC article.
-
Mechanisms of hypoglycemia-associated autonomic failure and its component syndromes in diabetes.Diabetes. 2005 Dec;54(12):3592-601. doi: 10.2337/diabetes.54.12.3592. Diabetes. 2005. PMID: 16306382 Review.
-
Hypoglycemia in diabetes: pathophysiological mechanisms and diurnal variation.Prog Brain Res. 2006;153:361-5. doi: 10.1016/S0079-6123(06)53021-3. Prog Brain Res. 2006. PMID: 16876586 Review.
Cited by
-
Whole-brain analysis of CO2 chemosensitive regions and identification of the retrotrapezoid and medullary raphé nuclei in the common marmoset (Callithrix jacchus).bioRxiv [Preprint]. 2023 Sep 28:2023.09.26.558361. doi: 10.1101/2023.09.26.558361. bioRxiv. 2023. PMID: 37986845 Free PMC article. Preprint.
-
Repeated Pharmacogenetic Catecholamine Neuron Activation in the Ventrolateral Medulla Attenuates Subsequent Glucoregulatory Responses.Diabetes. 2020 Dec;69(12):2747-2755. doi: 10.2337/db20-0402. Epub 2020 Sep 29. Diabetes. 2020. PMID: 32994274 Free PMC article.
-
Pentobarbital Anesthesia Suppresses the Glucose Response to Acute Intermittent Hypoxia in Rat.Front Physiol. 2021 Mar 5;12:645392. doi: 10.3389/fphys.2021.645392. eCollection 2021. Front Physiol. 2021. PMID: 33746780 Free PMC article.
-
Role of the Adrenal Medulla in Hypoglycaemia-Associated Autonomic Failure-A Diabetic Perspective.Metabolites. 2024 Jan 31;14(2):100. doi: 10.3390/metabo14020100. Metabolites. 2024. PMID: 38392992 Free PMC article. Review.
-
Slow but Steady-The Responsiveness of Sympathoadrenal System to a Hypoglycemic Challenge in Ketogenic Diet-Fed Rats.Nutrients. 2021 Jul 29;13(8):2627. doi: 10.3390/nu13082627. Nutrients. 2021. PMID: 34444787 Free PMC article.
References
-
- Bolli G, De Feo P, Compagnucci P, Cartechini MG, Angeletti G, Santeusanio F, Brunetti P, Gerich JE. Abnormal glucose counterregulation in insulin-dependent diabetes mellitus. Interaction of anti-insulin antibodies and impaired glucagon and epinephrine secretion. Diabetes 32: 134–141, 1983. doi:10.2337/diab.32.2.134. - DOI - PubMed
Publication types
MeSH terms
Substances
LinkOut - more resources
Full Text Sources
Medical
Miscellaneous

