

Early alterations in stem-like/resident T cells, innate and myeloid cells in the bone marrow in preneoplastic gammopathy
- PMID: 31013254
- PMCID: PMC6629164
- DOI: 10.1172/jci.insight.127807
Early alterations in stem-like/resident T cells, innate and myeloid cells in the bone marrow in preneoplastic gammopathy
Abstract
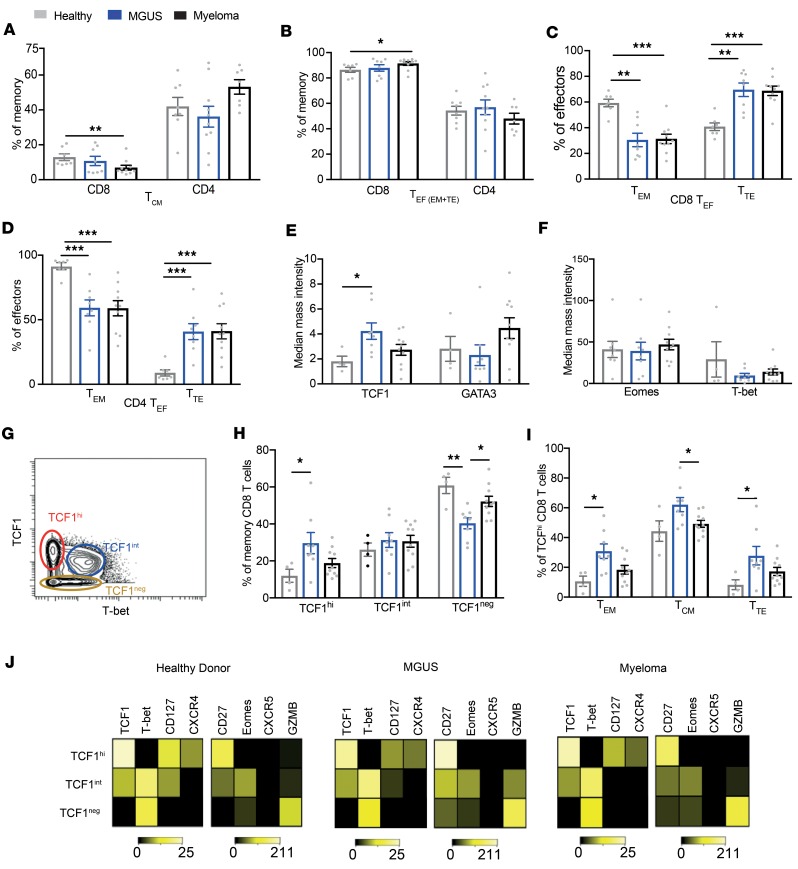
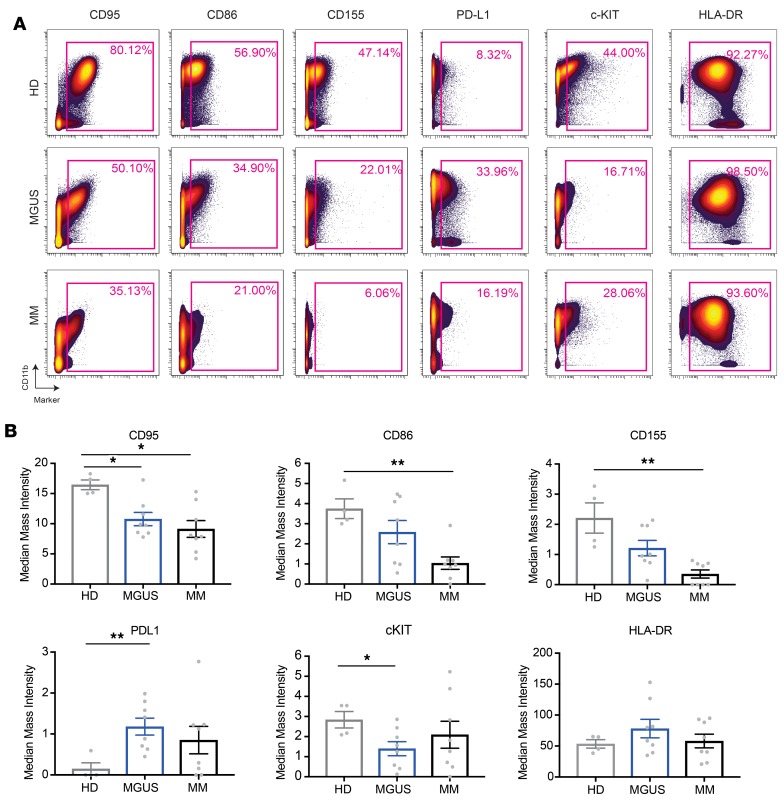
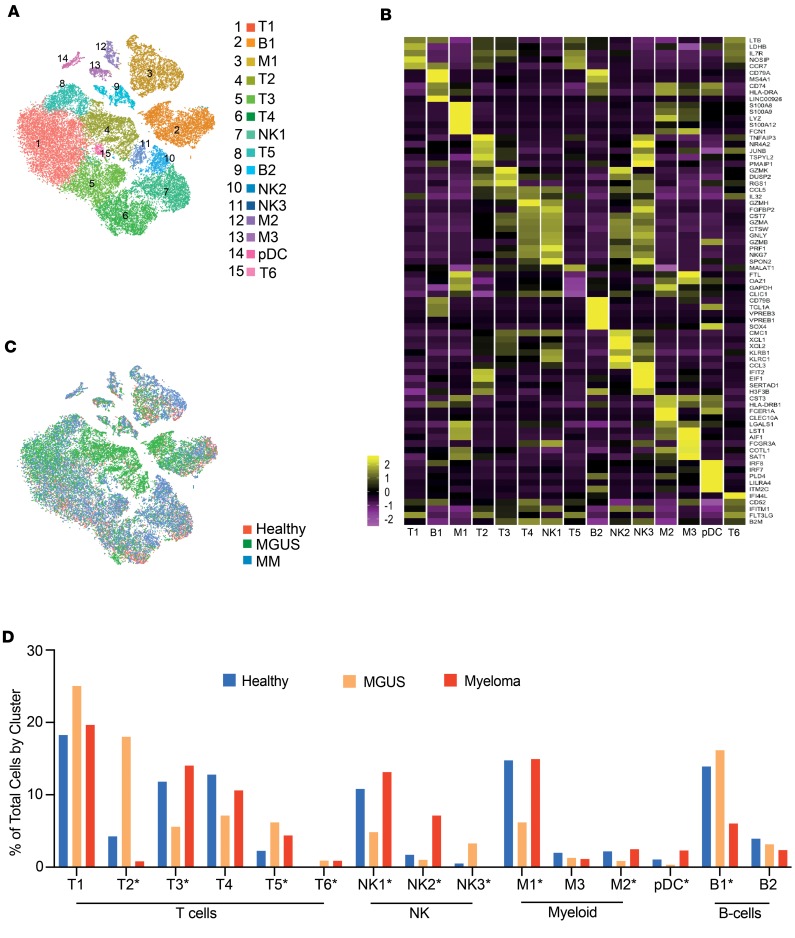
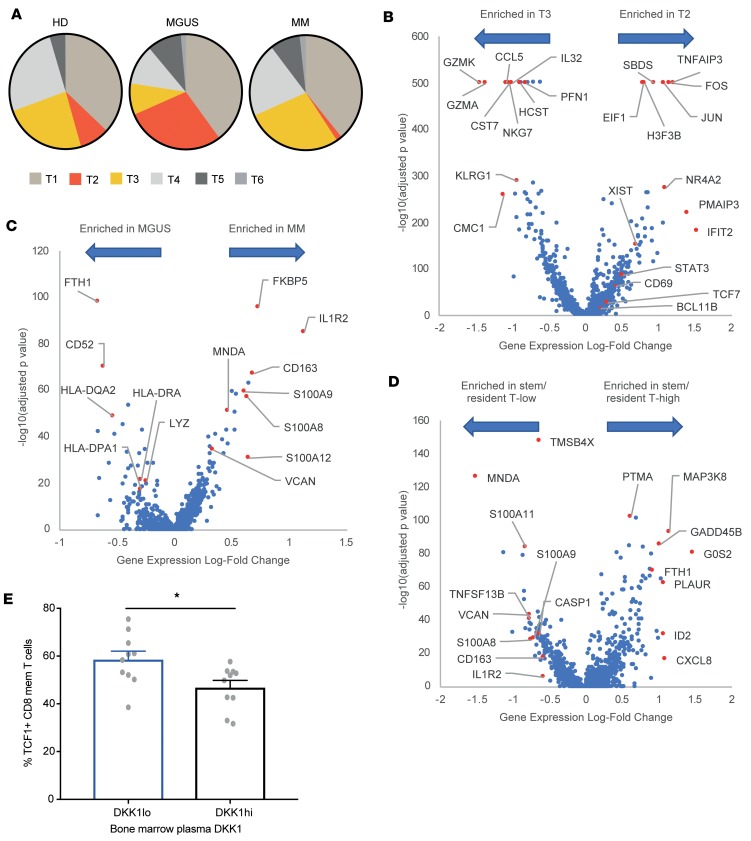
Preneoplastic lesions carry many of the antigenic targets found in cancer cells but often exhibit prolonged dormancy. Understanding how the host response to premalignancy is maintained and altered during malignant transformation is needed to prevent cancer. In order to understand the immune microenvironment in precursor monoclonal gammopathy of undetermined significance (MGUS) and myeloma, we analyzed bone marrow immune cells from 12 healthy donors and 26 MGUS/myeloma patients by mass cytometry and concurrently profiled transcriptomes of 42,606 single immune cells from these bone marrows. Compared to age-matched healthy donors, memory T cells from both MGUS and myeloma patients exhibit greater terminal-effector differentiation. However, memory T cells in MGUS show greater enrichment of stem-like TCF1/7hi cells. Clusters of T cells with stem-like and tissue-residence genes were also found to be enriched in MGUS by single-cell transcriptome analysis. Early changes in both NK and myeloid cells were also observed in MGUS. Enrichment of stem-like T cells correlated with a distinct genomic profile of myeloid cells and levels of Dickkopf-1 in bone-marrow plasma. These data describe the landscape of changes in both innate and adaptive immunity in premalignancy and suggest that attrition of the bone-marrow-resident T cell compartment due to loss of stem-like cells may underlie loss of immune surveillance in myeloma.
Keywords: Adaptive immunity; Cancer; Immunology; Oncology.
Conflict of interest statement
Figures
Similar articles
-
Co-evolution of Immune Response in Multiple Myeloma: Implications for Immune Prevention.Front Immunol. 2021 Feb 26;12:632564. doi: 10.3389/fimmu.2021.632564. eCollection 2021. Front Immunol. 2021. PMID: 33717170 Free PMC article. Review.
-
Multiparameter flow cytometric and transcriptional analyis of CD20 positive T-cells in bone marrow in patients of multiple myeloma and monoclonal gammopathy of undetermined significance.Front Immunol. 2025 Feb 26;16:1464940. doi: 10.3389/fimmu.2025.1464940. eCollection 2025. Front Immunol. 2025. PMID: 40079005 Free PMC article.
-
From MGUS to Multiple Myeloma, a Paradigm for Clonal Evolution of Premalignant Cells.Cancer Res. 2018 May 15;78(10):2449-2456. doi: 10.1158/0008-5472.CAN-17-3115. Epub 2018 Apr 27. Cancer Res. 2018. PMID: 29703720 Review.
-
Upregulation of Syndecan-1 in the bone marrow microenvironment in multiple myeloma is associated with angiogenesis.Eur J Haematol. 2015 Sep;95(3):211-7. doi: 10.1111/ejh.12473. Epub 2015 Jan 7. Eur J Haematol. 2015. PMID: 25353275
-
Multiple Myeloma and the Immune Microenvironment.Curr Cancer Drug Targets. 2017;17(9):806-818. doi: 10.2174/1568009617666170214102301. Curr Cancer Drug Targets. 2017. PMID: 28201978 Review.
Cited by
-
Versican and Versican-matrikines in Cancer Progression, Inflammation, and Immunity.J Histochem Cytochem. 2020 Dec;68(12):871-885. doi: 10.1369/0022155420937098. Epub 2020 Jul 6. J Histochem Cytochem. 2020. PMID: 32623942 Free PMC article. Review.
-
Immune dysregulation in multiple myeloma: the current and future role of cell-based immunotherapy.Int J Hematol. 2023 May;117(5):652-659. doi: 10.1007/s12185-023-03579-x. Epub 2023 Mar 25. Int J Hematol. 2023. PMID: 36964840 Free PMC article. Review.
-
CAR-T Therapy in Relapsed Refractory Multiple Myeloma.Curr Med Chem. 2024;31(27):4362-4382. doi: 10.2174/0109298673268932230920063933. Curr Med Chem. 2024. PMID: 37779413 Free PMC article. Review.
-
The yin-yang effects of immunity: From monoclonal gammopathy of undetermined significance to multiple myeloma.Front Immunol. 2022 Jul 25;13:925266. doi: 10.3389/fimmu.2022.925266. eCollection 2022. Front Immunol. 2022. PMID: 35958625 Free PMC article. Review.
-
Multipeptide stimulated PBMCs generate TEM/TCM for adoptive cell therapy in multiple myeloma.Oncotarget. 2021 Sep 28;12(20):2051-2067. doi: 10.18632/oncotarget.28067. eCollection 2021 Sep 28. Oncotarget. 2021. PMID: 34611479 Free PMC article.
References
Publication types
MeSH terms
Substances
Grants and funding
LinkOut - more resources
Full Text Sources
Medical
Molecular Biology Databases
