. 2019 Apr 23;5(11):e129278.
doi: 10.1172/jci.insight.129278.

Critical role of Interleukin 21 and T follicular helper cells in hypertension and vascular dysfunction

Affiliations

Critical role of Interleukin 21 and T follicular helper cells in hypertension and vascular dysfunction

Bethany L Dale et al. JCI Insight. .

Abstract

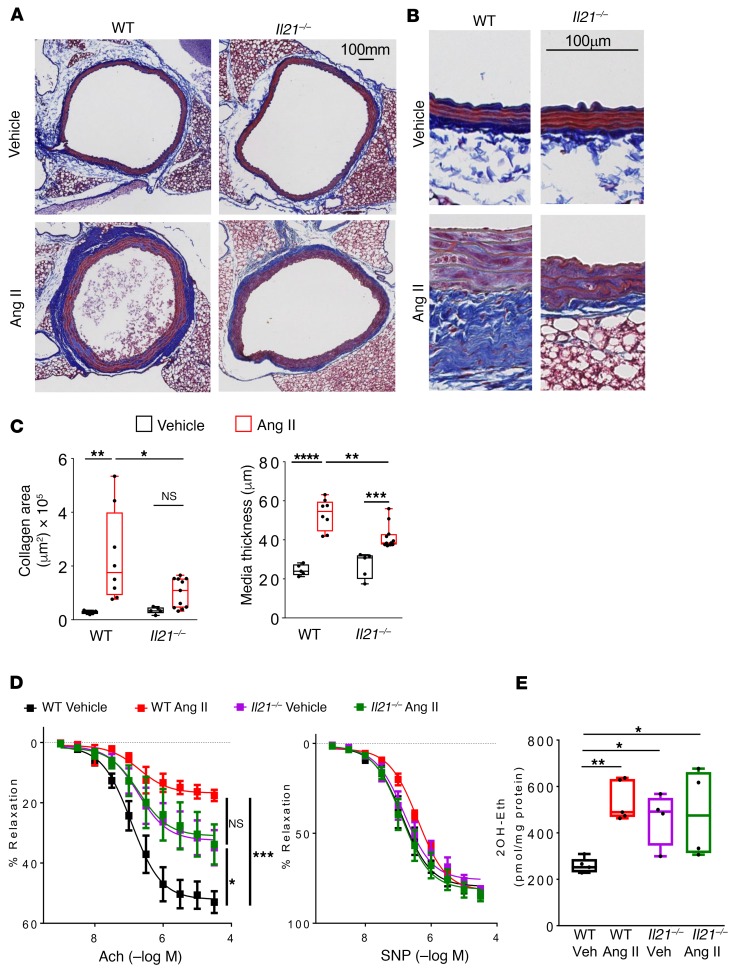
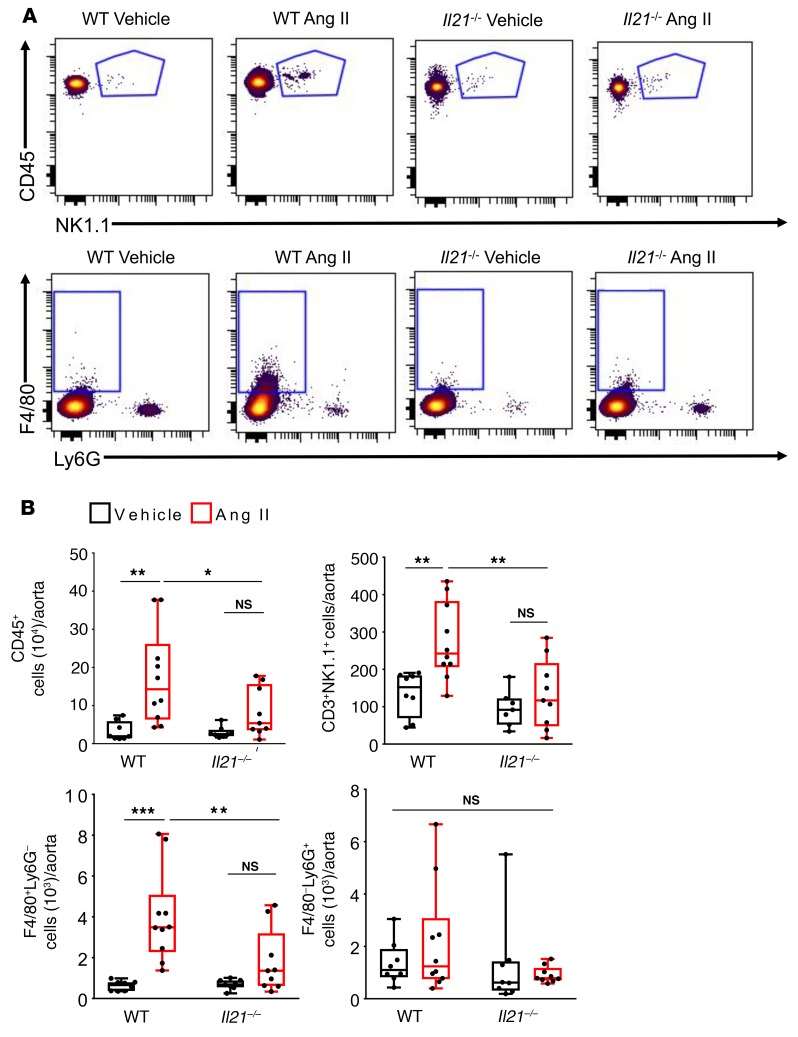
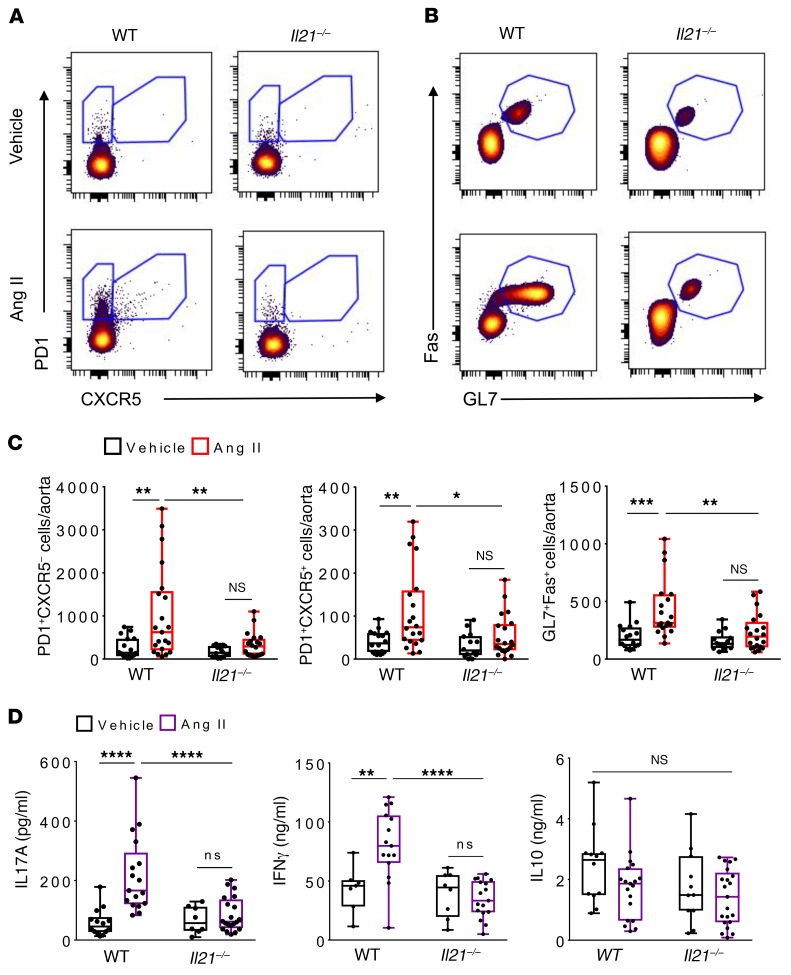
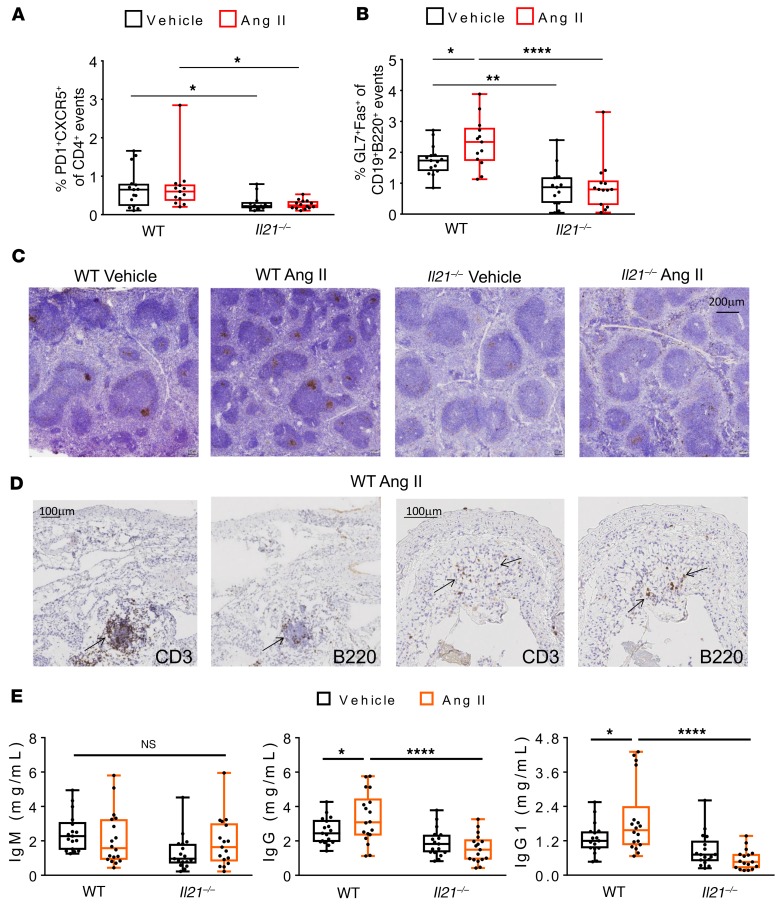
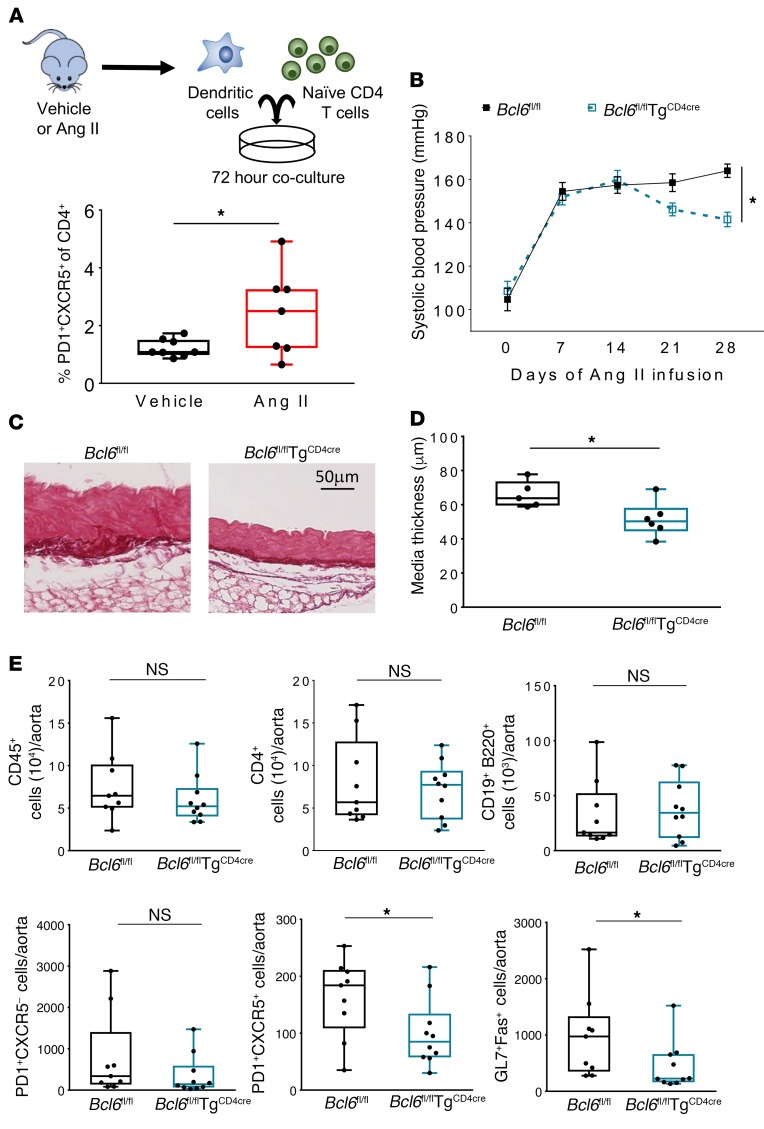
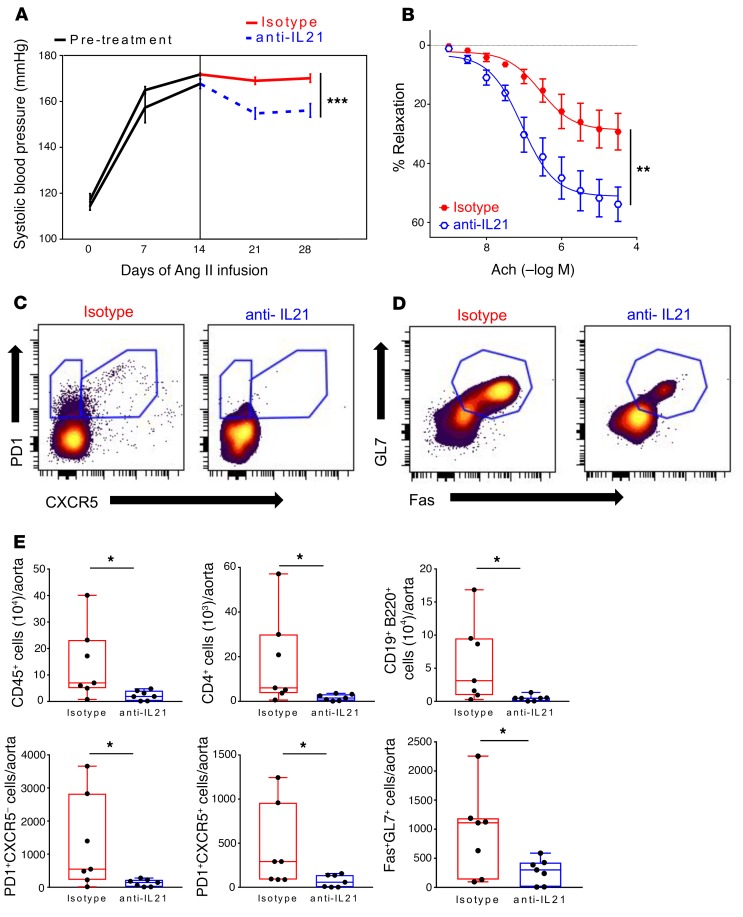
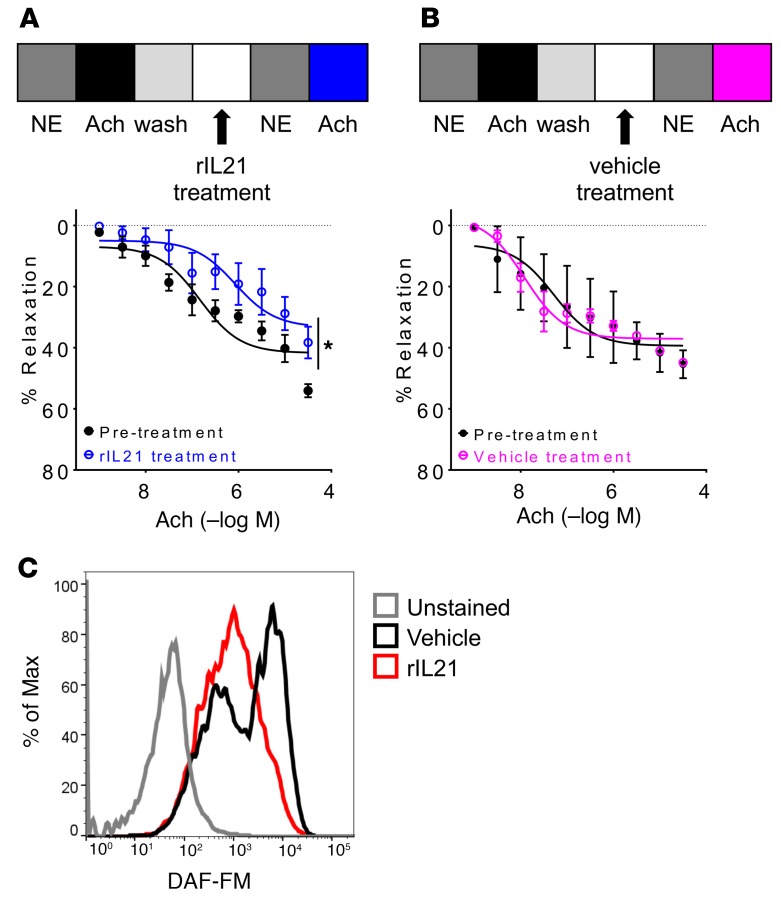
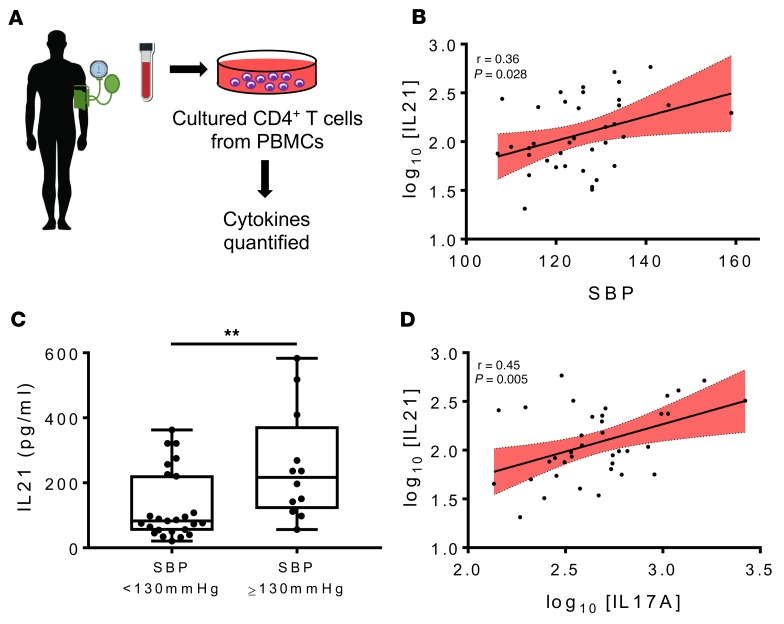
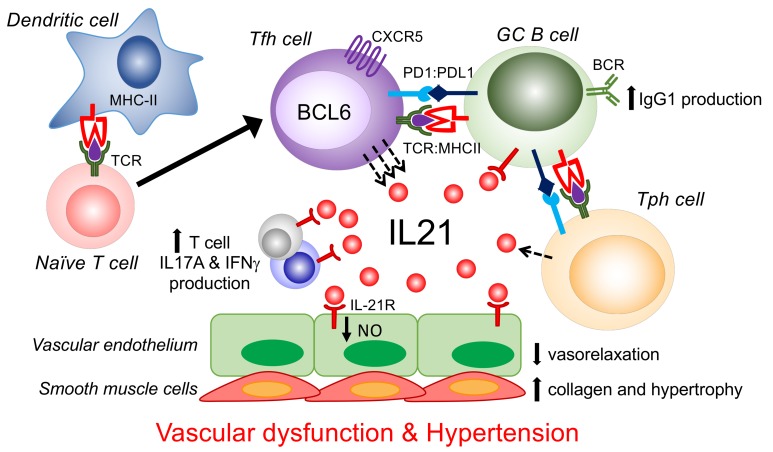
T and B cells have been implicated in hypertension, but the mechanisms by which they produce a coordinated response is unknown. T follicular helper (Tfh) cells that produce interleukin 21 (IL21) promote germinal center (GC) B cell responses leading to immunoglobulin (Ig) production. Here we investigate the role of IL21 and Tfh cells in hypertension. In response to angiotensin (Ang) II-induced hypertension, T cell IL21 production is increased, and Il21-/- mice develop blunted hypertension, attenuated vascular end-organ damage, and decreased interleukin 17A (IL17A) and interferon gamma production. Tfh-like cells and GC B cells accumulate in the aorta and plasma IgG1 is increased in hypertensive WT but not Il21-/-mice. Furthermore, Tfh cell deficient mice develop blunted hypertension and vascular hypertrophy in response to Ang II infusion. Importantly, IL21 neutralization reduces blood pressure (BP) and reverses endothelial dysfunction and vascular inflammation. Moreover, recombinant IL21 impairs endothelium-dependent relaxation ex vivo and decreases nitric oxide production from cultured endothelial cells. Finally, we show in humans that peripheral blood T cell production of IL21 correlates with systolic BP and IL17A production. These data suggest that IL21 may be a novel therapeutic target for the treatment of hypertension and its micro- and macrovascular complications.

Keywords: Adaptive immunity; Cardiology; Cardiovascular disease; Immunology; T cells.


Conflict of interest statement

Conflict of interest: TAI is a consultant for Fresenius Kabi, Corvidia, and Nestle, and MSM holds a patent on monocyte biomarkers for hypertension (PCT/US2018/029482).

Figures

Figure 1
Figure 1. Hypertension is associated with increased CD4+ T cell production of IL-21, and IL-21 deficiency blunts the hypertensive response to Ang II infusion.
(A) Relative Il21 mRNA expression by qRT-PCR from splenic CD4+ T cells cultured for 72 hours with anti-CD3/anti-CD28–coated plates (n = 5). (B) IL-21 protein was quantified in culture supernatants by ELISA (n = 7–13). (C) Systolic BP was measured by tail-cuff weekly over 28 days of Ang II infusion in WT and Il21–/– mice (n = 8–9). (D) Systolic BP, (E) diastolic BP, and (F) heart rate were measured invasively weekly using carotid radiotelemetry over 28 days of Ang II infusion in WT and Il21–/– mice (n = 5–8). Data are expressed as box-and-whisker plots (A and B) or mean ± SEM (CF); *P < 0.05, **P < 0.01, ****P < 0.0001 by Student’s t test (A and B) or 2-way ANOVA with repeated measures (CF).
Figure 2
Figure 2. Loss of IL-21 protects against Ang II–induced vascular remodeling and endothelial dysfunction.
WT and Il21–/– mice were infused with Ang II or vehicle for 28 days. Representative images of (A) bright-field aortic collagen deposition and (B) media thickness by Masson’s trichrome blue staining. Scale bars: 100 mm (A); 100 μm (B). (C) Quantification of aortic collagen deposition area and media thickness (n = 5–11). (D) Endothelium-dependent relaxation in response to increasing doses of acetylcholine (Ach) (left) and endothelium-independent relaxation in response to increasing doses of sodium nitroprusside (SNP) (right) were measured in isolated mesenteric arterioles (n = 6–8). (E) Superoxide levels from mesenteric arterioles as measured by quantification of 2-hydroxyethidium (2OH-Eth) (n = 4–5). Data are expressed as box-and-whisker plots (C and E) or mean ± SEM (D); *P < 0.05, **P < 0.01, ***P < 0.001, ****P < 0.0001 by 2-way ANOVA (CE).
Figure 3
Figure 3. IL-21 deficiency blunts early vascular infiltration of NKT cells and macrophages.
(A) Representative flow cytometry biaxial plots for NKT cells (NK1.1+), macrophages (F4/80+Ly6G), and neutrophils (F4/80Ly6G+) in the aorta of WT and Il21–/– mice infused with Ang II or vehicle for 7 days. (B) Summary quantification of leukocytes (CD45+ cells), NKT cells (CD3+NK1.1+ cells), macrophages (F4/80+Ly6G), and neutrophils (F4/80Ly6G+) (n = 7–10). Data are expressed as box-and-whisker plots; *P < 0.05, **P < 0.01, ***P < 0.001 by 2-way ANOVA.
Figure 4
Figure 4. Hypertension induces peripheral T helper, T follicular helper, and GC B cells in the aorta in an IL-21–dependent manner.
(A) Representative flow cytometry biaxial plots for peripheral T helper (Tph; PD-1+CXCR5), T follicular helper (Tfh; PD-1+CXCR5+), and (B) GC B cells (GL7+Fas+) in the aorta of WT and Il21–/– mice infused with Ang II or vehicle for 28 days. (C) Summary quantification of Tph, Tfh, and GC B cells (n = 14–21). (D) Splenic CD4+ T cell production of IL-17A and IL-10 and CD8+ T cell production of IFN-γ from WT and Il21–/– mice infused with Ang II or vehicle for 28 days quantified by ELISA (n = 7–21). Data are expressed as box-and-whisker plots; *P < 0.05, **P < 0.01, ***P < 0.001, ****P < 0.0001 by 2-way ANOVA.
Figure 5
Figure 5. Hypertension induces an IL-21–dependent GC response, tertiary lymphoid development, and increased IgG production.
WT and Il21–/– mice were infused with Ang II or vehicle for 28 days. (A) Percent Tfh cells (PD-1+CXCR5+) of CD4+ T cells and (B) percent GC B cells (GL7+Fas+) of total CD19+B220+ B cells from mesenteric lymph nodes (n = 13–15). (C) Bright-field images of splenic cross sections stained for the GC B cell marker PNA (representative of n = 4–7). (D) Example bright-field images of aortic sections stained for CD3 (T cells) and B220 (B cells). Scale bars: 200 μm (C); 100 μm (D). (E) Plasma Ig concentration of IgM, IgG, and IgG1 (n = 17–18). Data are expressed as box-and-whisker plots; *P < 0.05, **P < 0.01, ****P < 0.0001 by 2-way ANOVA.
Figure 6
Figure 6. Hypertensive DCs induce Tfh cell polarization, and Tfh cells play a critical role in hypertension.
(A) DCs were isolated from the spleen of WT mice infused with Ang II or vehicle for 14 days and cocultured with splenic naive CD4+ T cells from vehicle-infused WT mice (top). Percent Tfh cells (PD-1+CXCR5+) of CD4 + T cells was determined by flow cytometry (n = 7–8) (bottom). (B) Systolic BP was measured by tail-cuff weekly over 28 days of Ang II infusion in Bcl6fl/fl TgCD4cre and control Bcl6fl/fl littermates (n = 9–11). (C) Representative images of bright-field aortic wall thickness by Picrosirius red staining. Scale bar: 50 μm. (D) Quantification of aortic wall thickness (n = 5–6). (E) Summary quantification of total leukocytes (CD45+), T helper (CD4+), B (CD19+B220+), Tph (PD-1+CXCR5), Tfh (PD-1+CXCR5+), and GC B (GL7+Fas+) cells in the aorta from Bcl6fl/fl TgCD4cre and control Bcl6fl/fl littermates infused with Ang II for 28 days (n = 9–10). Data are expressed as box-and-whisker plots (A, D, and E) or mean ± SEM (B); *P < 0.05 by Student’s t-test (A, D, and E) or 2-way ANOVA with repeated measures (B).
Figure 7
Figure 7. Anti–IL-21 treatment lowers BP and reverses endothelial dysfunction and vascular inflammation.
(A) Systolic BP was measured by tail-cuff weekly over 28 days of Ang II infusion. Isotype control or IL-21–neutralizing antibodies were administered twice weekly during the last 2 weeks of Ang II infusion (n = 7–8). (B) Endothelium-dependent relaxation in response to increasing doses of Ach was measured in both groups (n = 7–8). Representative flow cytometry biaxial plots for (C) Tph (PD-1+CXCR5), Tfh (PD-1+CXCR5+), and (D) GC B (GL7+Fas+) cells in the aorta from both groups. (E) Summary quantification of total leukocytes (CD45+), T helper (CD4+), B (CD19+B220+), Tph, Tfh, and GC B cells from both groups (n = 7). Data are expressed as mean ± SEM (A and B) or box-and-whisker plots (E); *P < 0.05, **P < 0.01, ***P < 0.001 by 2-way ANOVA with repeated measures (A) or Student’s t test (B and E).
Figure 8
Figure 8. Recombinant IL-21 impairs endothelium-dependent relaxation ex vivo and decreases NO production from cultured human aortic endothelial cells.
(A and B) Schematic of ex vivo treatment of WT mesenteric arterioles (top), and endothelium-dependent relaxation in response to increasing doses of acetylcholine (Ach) before and after treatment with recombinant IL-21 (rIL21) (A, n = 5) or vehicle (B, n = 3). NE, norepinephrine. (C) Histogram of 4-amino-5-methylamino-2′,7′-diflurofluorescein diacetate (DAF-FM) fluorescence in cultured human aortic endothelial cells treated with recombinant IL-21 or vehicle (representative of n = 4). Data are expressed as mean ± SEM (A and B); *P < 0.05 by paired Student’s t test (A and B).
Figure 9
Figure 9. CD4+ T cell production of IL-21 correlates with systolic BP and IL-17A in humans.
(A) Systolic BP (SBP) was determined at the time of blood draw in human subjects. CD4+ T cells were isolated from PBMCs and cultured for 3 days. Cytokines were then quantified from the supernatants. (B) CD4+ T cell production of IL-21 versus SBP in humans (n = 37). (C) Human CD4+ T cell production of IL-21 dichotomized by SBP <130 mmHg or ≥130 mmHg (n = 12–25). (D) CD4+ T cell production of IL-21 versus IL-17A in humans (n = 37). Pearson’s correlation coefficient and corresponding P value are shown on the graph (B and D). Data are expressed as box-and-whisker plots (C); **P < 0.01 by Student’s t test (C).
Figure 10
Figure 10. Working model of how IL-21 functions as a master cytokine in hypertension coordinating T, B, and somatic cell responses.
TCR, T cell receptor; MHCII, major histocompatibility complex II; BCR, B cell receptor.

References

    1. Whelton PK, et al. 2017 ACC/AHA/AAPA/ABC/ACPM/AGS/APhA/ASH/ASPC/NMA/PCNA Guideline for the prevention, detection, evaluation, and management of high BP in adults: executive summary: a report of the American College of Cardiology/American Heart Association Task Force on Clinical Practice Guidelines. Hypertension. 2018;71(6):1269–1324. doi: 10.1161/HYP.0000000000000066. - DOI - PubMed
    1. GBD 2015 Risk Factors Collaborators Global, regional, and national comparative risk assessment of 79 behavioural, environmental and occupational, and metabolic risks or clusters of risks, 1990-2015: a systematic analysis for the Global Burden of Disease Study 2015. Lancet. 2016;388(10053):1659–1724. doi: 10.1016/S0140-6736(16)31679-8. - DOI - PMC - PubMed
    1. Nwankwo T, Yoon SS, Burt V, Gu Q. Hypertension among adults in the United States: National Health and Nutrition Examination Survey, 2011-2012. NCHS Data Brief. 2013;null(133):1–8. - PubMed
    1. Okuda T, Grollman A. Passive transfer of autoimmune induced hypertension in the rat by lymph node cells. Tex Rep Biol Med. 1967;25(2):257–264. - PubMed
    1. White FN, Grollman A. Autoimmune factors associated with infarction of the kidney. Nephron. 1964;1:93–102. doi: 10.1159/000179322. - DOI - PubMed

Publication types

MeSH terms