. 2019 Apr 23;5(11):e127305.
doi: 10.1172/jci.insight.127305.

Targeting self and neo-epitopes with a modular self-adjuvanting cancer vaccine

Affiliations

Targeting self and neo-epitopes with a modular self-adjuvanting cancer vaccine

Elodie Belnoue et al. JCI Insight. .

Abstract

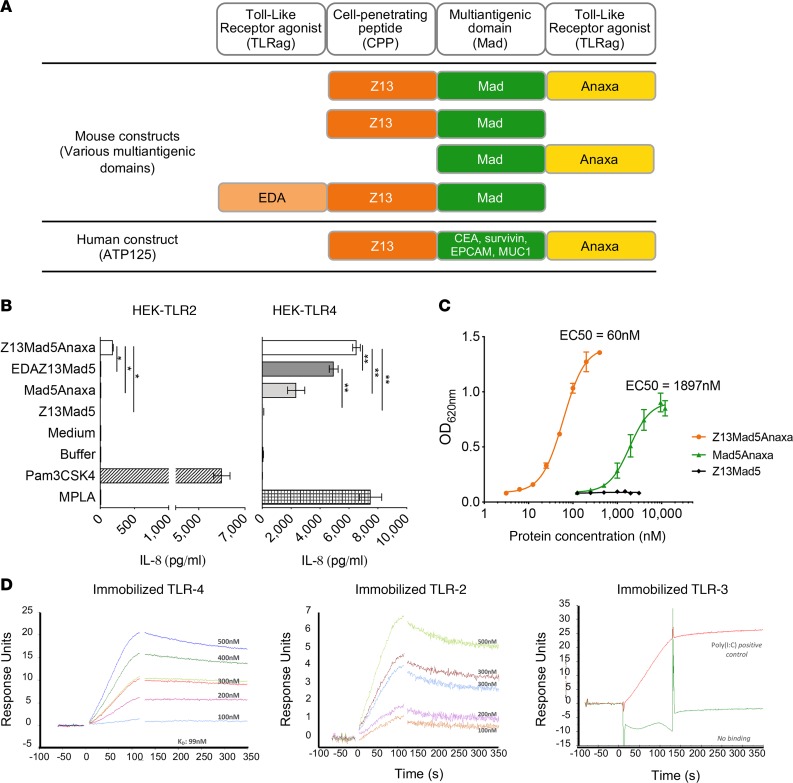
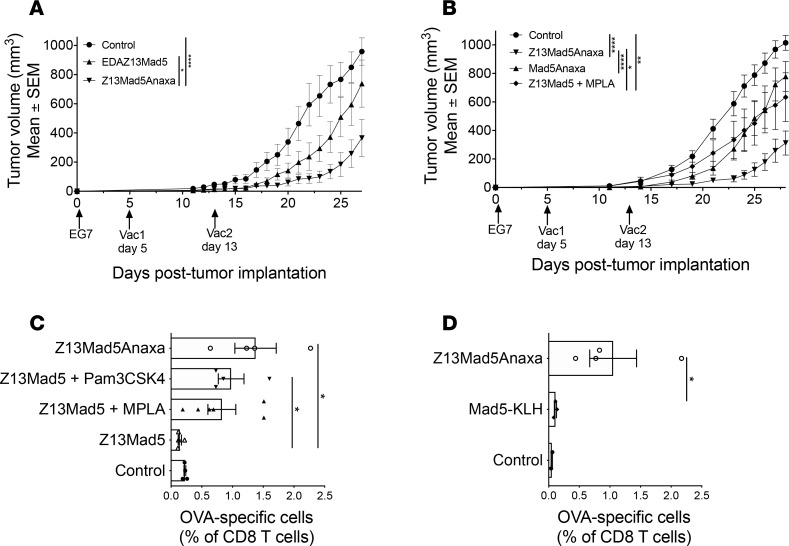
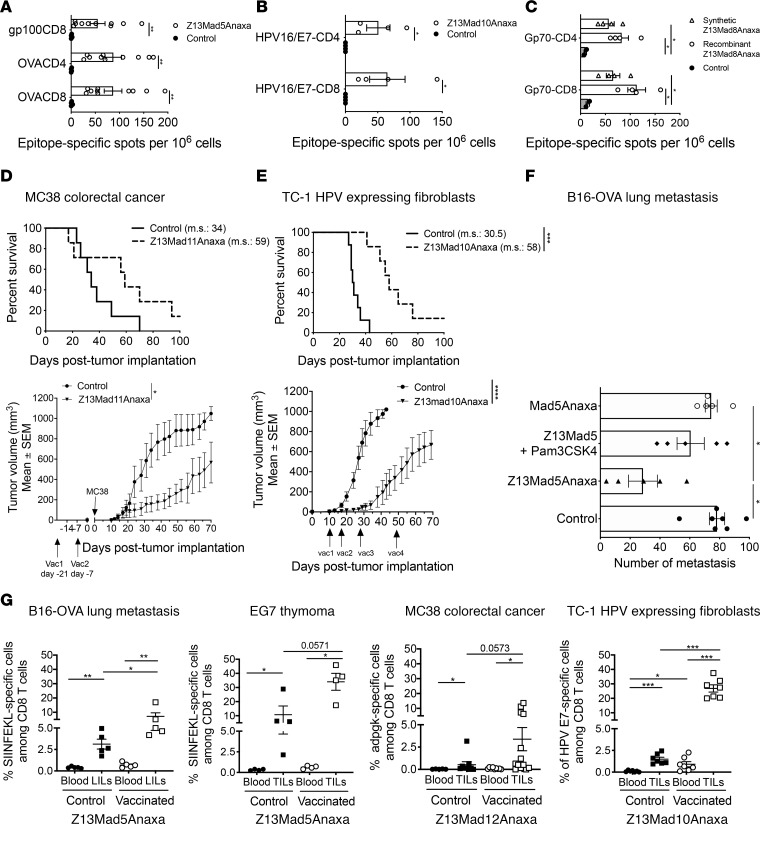
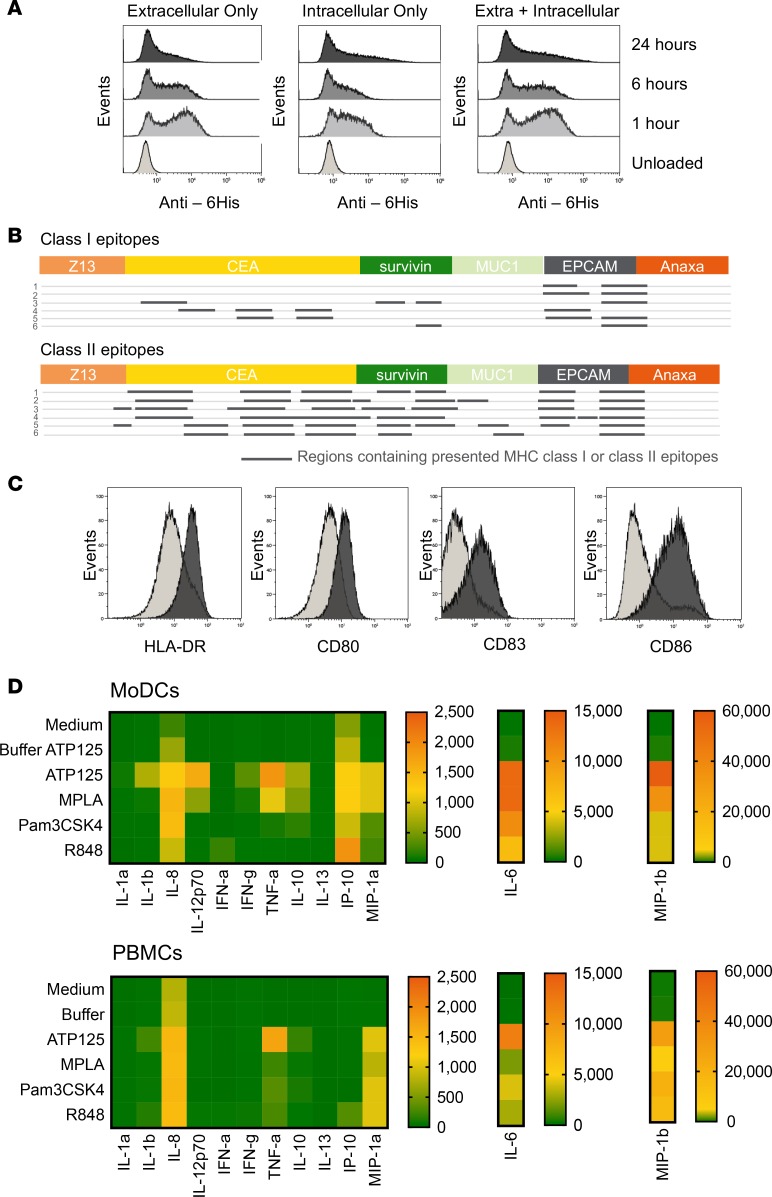
Induction of a potent CD4 and CD8 T-cell response against tumor-specific and tumor-associated antigen is critical for eliminating tumor cells. Recent vaccination strategies have been hampered by an inefficacious and low amplitude immune response. Here we describe a self-adjuvanted chimeric protein vaccine platform to address these challenges, characterized by a multidomain construction incorporating (i) a cell penetrating peptide (CPP) allowing internalization of several multiantigenic Major Histocompatibility Complex (MHC)-restricted peptides within (ii) the multiantigenic domain (Mad) and (iii) a TLR2/4 agonist domain (TLRag). Functionality of the resulting chimeric protein is based on the combined effect of the above-mentioned three different domains for simultaneous activation of antigen presenting cells and antigen cross-presentation, leading to an efficacious multiantigenic and multiallelic cellular immune response. Helper and cytotoxic T-cell responses were observed against model-, neo- and self-antigens, and were highly potent in several murine tumor models. The safety and the immunogenicity of a human vaccine candidate designed for colorectal cancer treatment was demonstrated in a non-human primate model. This newly engineered therapeutic vaccine approach is promising for the treatment of poorly infiltrated tumors that do not respond to currently marketed immunotherapies.

Keywords: Cellular immune response; Colorectal cancer; Immunotherapy; Oncology; Vaccines.


Conflict of interest statement

Conflict of interest: EB, JFM, WDBB, SC, ED, MLSR, and MD are employees of AMAL Therapeutics. MD has ownership interests in AMAL Therapeutics. MD and PRW are the inventors of patents related to the CPP (US 9,187,534 and PCT/IB2013/058497). MD and EB are inventors in patents related to KISIMA (PCT/EP2016/000471). PRW is a consultant/advisory board member for AMAL Therapeutics.

Figures

Figure 1
Figure 1. Optimization of the vaccine construct based on self-adjuvanticity.
(A) The KISIMA vaccination platform consists of 3 modules: the cell-penetrating peptide, the multiantigenic domain, and the TLR agonist. (B) HEK-Blue hTLR2 cells and HEK-Blue hTLR4 cells were incubated with 1 μM of vaccine construct or adjuvant (MPLA or Pam3Cys) medium or buffer. After 24 hours, supernatants were harvested and IL-8 measured by ELISA. One experiment shown is representative of 2 (mean ± SEM). *P < 0.05; **P < 0.01 (unpaired t test). (C) THP1-XBlue-MD2-CD14 cells were incubated with various concentrations of vaccine constructs, medium, or buffer. After 18 hours, supernatants were recovered, and SEAP activity was measured by QUANTI-Blue assay (InvivoGen). The EC50 of the Z13Mad5Anaxa and Mad5Anaxa was calculated from the obtained dose-response curves using Prism software. (D) The binding of ATP125 to TLR4, TLR2, and TLR3 was measured by surface plasmon resonance analysis for different concentrations of ATP125: 100, 200, 300 (in duplicate), 400, and 500 nM and sensorgrams were obtained. All curves indicate the response after subtraction of nonspecific binding of molecules to a control channel.
Figure 2
Figure 2. Z13Mad5Anaxa showed the strongest antitumor effect.
(A) Tumor growth curve of C57BL/6 mice (n = 7 mice/group) implanted s.c. with EG7-OVA cells and vaccinated twice (day 5 and day 13) with EDAZ13Mad5 or Z13Mad5Anaxa proteins. Values are represented as the mean ± SEM. One experiment shown is representative of 2. *P < 0.05; ****P < 0.0001 (2-way ANOVA). (B) Tumor growth curve of C57BL/6 mice (n = 7 to 14 mice/group) implanted s.c. with EG7-OVA cells and vaccinated twice (day 5 and day 13) with Z13Mad5Anaxa, Mad5Anaxa, or Z13Mad5 with MPLA. Values are represented as the mean ± SEM. A pool of 2 independent experiments is shown. *P < 0.05; **P < 0.01, ****P < 0.0001 (2-way ANOVA). (C) Mice were vaccinated twice (day 0 and day 14) with different constructs with or without adjuvants. One week after the last vaccination, multimer staining was performed on blood cells for detecting OVA257-264–specific CD8 T cells. A pool of 3 independent experiments is shown (mean ± SEM, n = 4 to 6 mice/group). *P < 0.05 (Kruskal-Wallis test). (D) Mice were vaccinated 3 times (day 0, day 14, day 28) with 2 different constructs. One week after the last vaccination, multimer staining was performed on blood cells for detecting OVA257–264-specific CD8 T cells (mean ± SEM, n = 2 to 4 mice/group). *P < 0.05 (Kruskal-Wallis test).
Figure 3
Figure 3. KISIMA vaccine induces antigen-specific T cell response in several tumor models.
(A) Mice were vaccinated 6 times with Z13Mad5Anaxa, (B) 4 times with Z13Mad10Anaxa, and (C) 4 times with Z13Mad8Anaxa as a recombinant protein or synthetic peptide. One week after the last vaccination, ELISPOT assays were performed on spleen cells for detecting (A) IFN-γ–producing OVA257–264–specific CD8 T cells (OVACD8), OVA323–339–specific CD4 T cells (OVACD4), and gp10025–33–specific CD8 T cells (gp100CD8). A pool of 2 independent experiments is shown (n = 4 to 10 mice/group). **P < 0.01 (Mann-Whitney test). (B) IFN-γ–producing HPV16E749-57–specific CD8 T cells and HPV16E748–57–specific CD4 T cells (n = 4 mice/group). *P < 0.05 (Mann-Whitney test). (C) IFN-γ–producing gp70427–435–specific CD8 T cells (Gp70-CD8) and gp70609–622–specific CD4 T cells (Gp70-CD4) (n = 2 to 4 mice/group). *P < 0.05 (Mann-Whitney test). (D) Survival curve and mean tumor volume of C57BL/6 mice (n = 7 mice/group) vaccinated with Z13Mad11Anaxa 21 and 7 days before s.c. implantation with MC38 cells. Median survival is indicated on the graph (m.s.). (E) Survival curve and mean tumor volume of C57BL/6 mice (n = 7 mice/group) implanted s.c. with TC-1 cells. Mice were vaccinated at day 10, day 17, day 28, and day 49 with Z13Mad10Anaxa. Median survival is indicated on the graph (m.s.). One experiment shown is representative of 3. *P < 0.05, ***P < 0.001, ****P < 0.0001 (log-rank test). (F) Mice were implanted i.v. with B16-OVA cells and vaccinated twice (day 0 and day 10) with Z13Mad5Anaxa, Mad5Anaxa, or Z13Mad5 with Pam3CSK4. On day 17, mice were euthanized and the number of lung metastatic foci was counted (n = 5 to 7 mice/group). A pool of 2 independent experiments is shown. *P < 0.05 (Kruskal-Wallis test). (G) For different tumor models, blood cells and lung (LILs) or TILs from control and vaccinated mice were analyzed for antigen-specific CD8 T cells. C57BL/6 mice were implanted (a) i.v. with B16-OVA tumor cells, vaccinated at day 0 and day 10 and analyzed 2 weeks later (n = 5 mice/group); (b) s.c. with EG7 cells, vaccinated at day 5 and d13 and analyzed 1 week later (n = 4 mice/group); (c) s.c. with MC38 colorectal tumor cells, vaccinated at day 3, day 10, and day 17 and analyzed 1 week later (a pool of 3 independent experiments is shown [n = 10 to 14 mice/group]); or (d) s.c. with TC-1 tumor cells, vaccinated at day 7 and day 14 and analyzed 2 weeks later (a pool of 2 independent experiments is shown [n = 7 mice/group]). *P < 0.05, **P < 0.01, ***P < 0.001 (Mann-Whitney test). (AG) Mean ± SEM are shown.
Figure 4
Figure 4. ATP125 is processed and presented by human DCs.
(A) Representative intracellular and extracellular anti-His staining of human DCs stimulated with 300 nM of ATP125. One experiment shown is representative of 3. (B) Identification of naturally presented HLA class I– and HLA class II–restricted peptides by ATP125-loaded human DCs using a mass spectrometry–based immunopeptidomics approach. The bold lines indicate regions of the recombinant protein containing HLA class I– or class II–presented peptides. (C) Human DCs were cultured overnight with 300 nM of ATP125 before cytometry analysis. Histograms of activation markers are shown. One experiment shown is representative of 3. (D) Heatmap of secreted cytokines/chemokines (pg/ml) by 24-hour activated human DCs (n = 3) or human PBMCs (n = 3) with 300 nM of ATP125, MPLA (TLR4 ligand), Pam3CSK4 (TLR2 ligand), or R848 (TLR7/8 ligand), equivalent volume of ATP125 buffer and control cells.
Figure 5
Figure 5. ATP125 elicits T cell responses in NHPs.
(A) Vaccination and assessment schedule of Cynomolgus fascicularis NHPs. (B) Cellular immune response against CEA, MUC-1, survivin, and EPCAM was monitored by IFN-γ ELISPOT on PBMC prior to any vaccination (left panel) or 1 week after the last vaccination on day 50 (left panel) in animals vaccinated with 76 or 380 μg of ATP125 s.c. or i.d. Representative ELISPOT IFN-γ wells for 1 animal of 3 for each treatment group are shown.
Figure 6
Figure 6. Self-adjuvanting efficacy of KISIMA vaccines further enhanced with anti-PD1 therapy.
(A) Survival curve and mean tumor volume of C57BL/6 mice (n = 14 mice/group) implanted s.c. with MC38 cells. One group was used as control. In the other groups, mice were vaccinated with Z13Mad12Anaxa s.c. on day 3, day 10, and day 17, injected with a mouse-specific anti-PD1 i.p. from day 6 to day 31, or received the combination treatment. A pool of 2 independent experiments is shown. (B) Survival curve and mean tumor volume of C57BL/6 mice (n = 7 mice/group) implanted s.c. with TC-1 cells. One group was used as control. In the other groups, mice were vaccinated with Z13Mad10Anaxa s.c. on day 7, day 14, day 28, and day 49, injected with a mouse-specific anti-PD1 i.v. on the same days, day 7, day 14, day 28, and day 4, or received the combination treatment. One experiment shown is representative of 3. Median survival is indicated on the survival graph (m.s.). *P < 0.05; **P < 0.01; ***P < 0.001, ****P < 0.0001 (log-rank test). *P < 0.05, **P < 0.01, ****P < 0.0001 (2-way ANOVA for tumor growth curves).

Similar articles

Cited by

References

    1. Guo C, Manjili MH, Subjeck JR, Sarkar D, Fisher PB, Wang XY. Therapeutic cancer vaccines: past, present, and future. Adv Cancer Res. 2013;119:421–475. - PMC - PubMed
    1. Melief CJ, van Hall T, Arens R, Ossendorp F, van der Burg SH. Therapeutic cancer vaccines. J Clin Invest. 2015;125(9):3401–3412. doi: 10.1172/JCI80009. - DOI - PMC - PubMed
    1. Dagogo-Jack I, et al. Circulating tumor DNA identifies EGFR coamplification as a mechanism of resistance to crizotinib in a patient with advanced MET-amplified lung adenocarcinoma. J Thorac Oncol. 2017;12(10):e155–e157. doi: 10.1016/j.jtho.2017.04.023. - DOI - PMC - PubMed
    1. Alizadeh AA, et al. Toward understanding and exploiting tumor heterogeneity. Nat Med. 2015;21(8):846–853. doi: 10.1038/nm.3915. - DOI - PMC - PubMed
    1. Sampson JH, et al. Immunologic escape after prolonged progression-free survival with epidermal growth factor receptor variant III peptide vaccination in patients with newly diagnosed glioblastoma. J Clin Oncol. 2010;28(31):4722–4729. doi: 10.1200/JCO.2010.28.6963. - DOI - PMC - PubMed

Publication types

MeSH terms