Meta-Analysis
. 2019 Apr 23;16(4):e1002782.
doi: 10.1371/journal.pmed.1002782. eCollection 2019 Apr.

Socioeconomic position and use of healthcare in the last year of life: A systematic review and meta-analysis

Affiliations
Meta-Analysis

Socioeconomic position and use of healthcare in the last year of life: A systematic review and meta-analysis

Joanna M Davies et al. PLoS Med. .

Erratum in

Abstract

Background: Low socioeconomic position (SEP) is recognized as a risk factor for worse health outcomes. How socioeconomic factors influence end-of-life care, and the magnitude of their effect, is not understood. This review aimed to synthesise and quantify the associations between measures of SEP and use of healthcare in the last year of life.

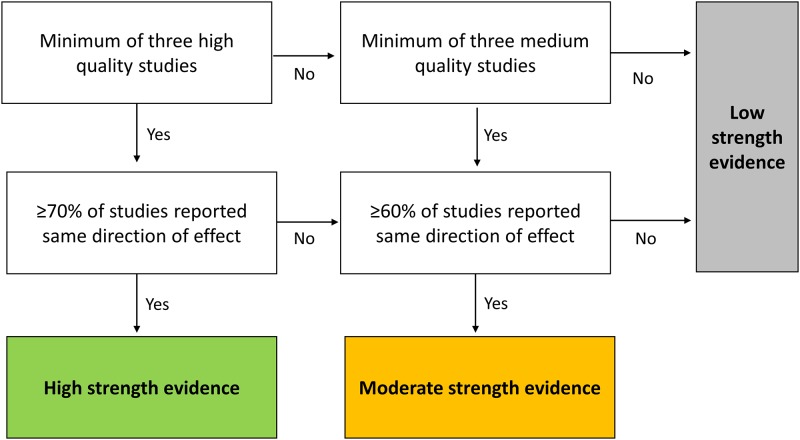
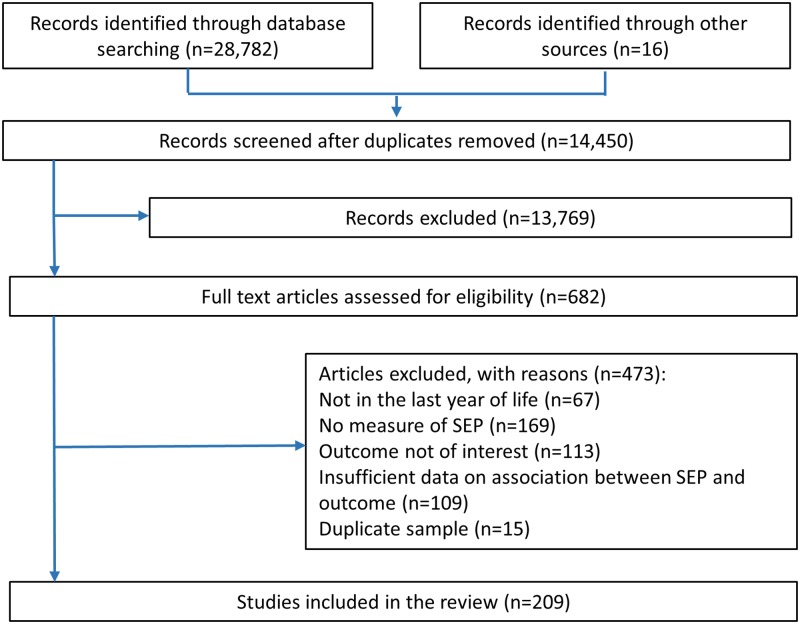
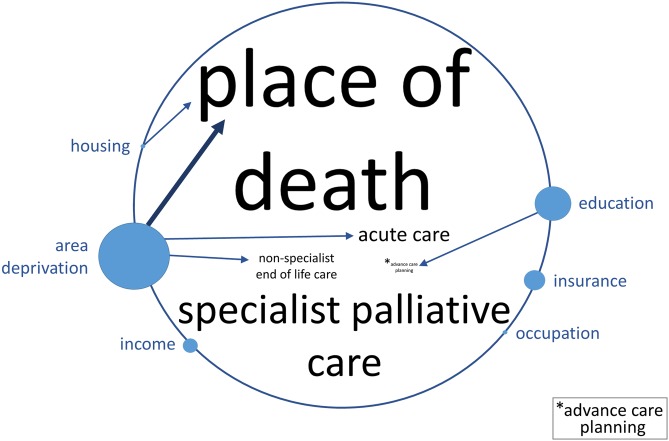
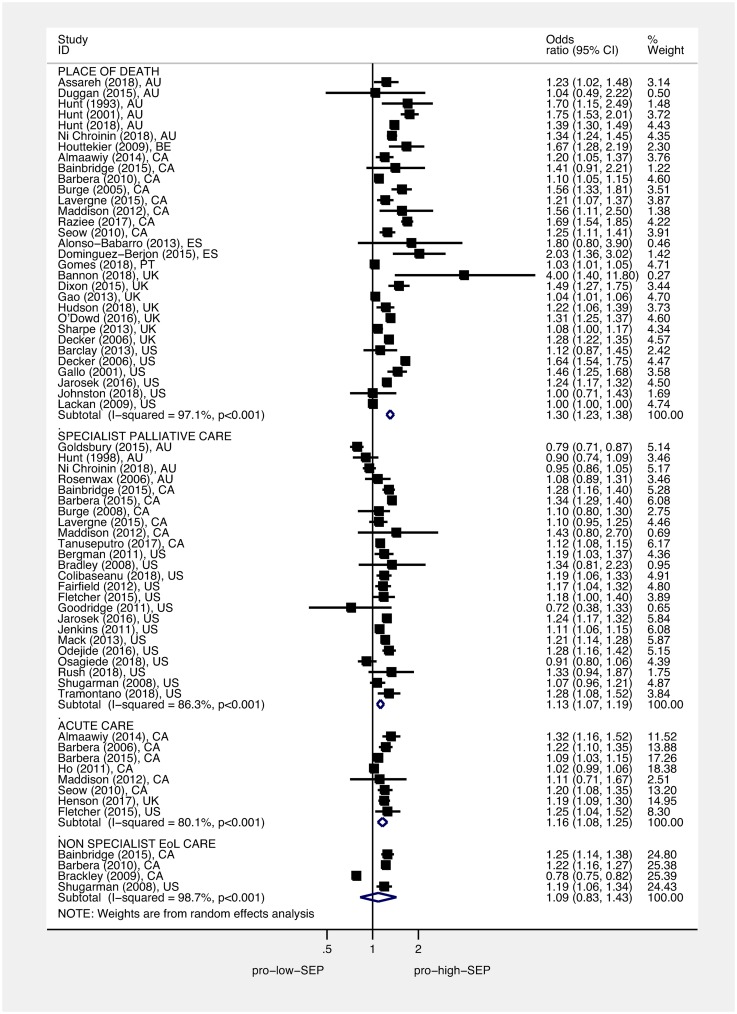
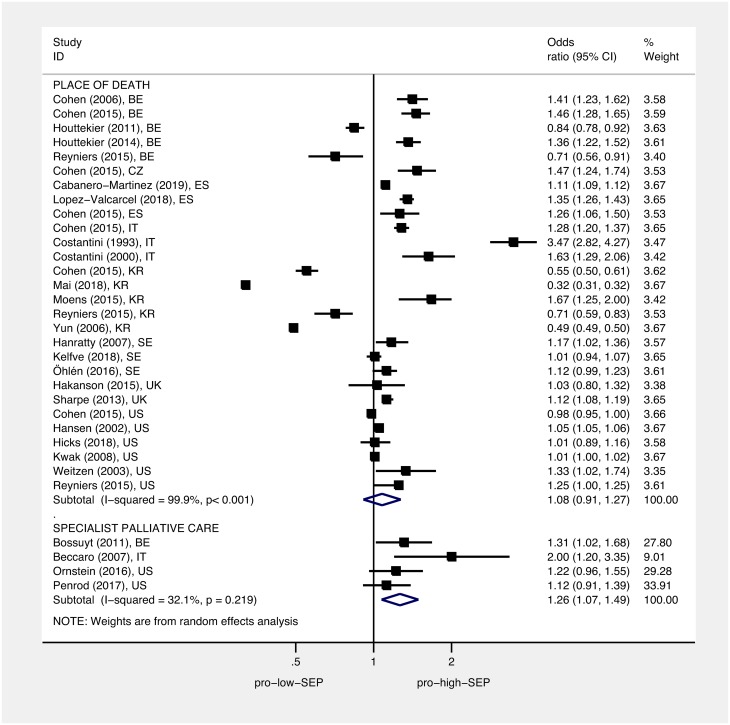
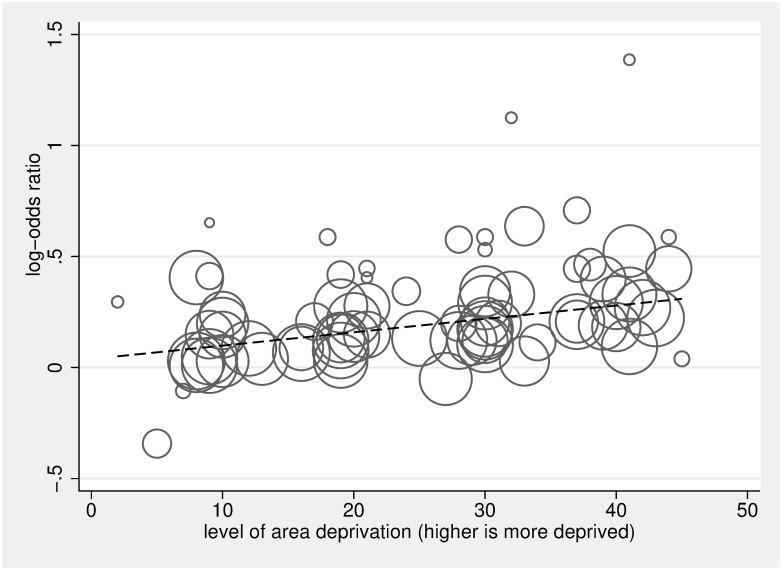
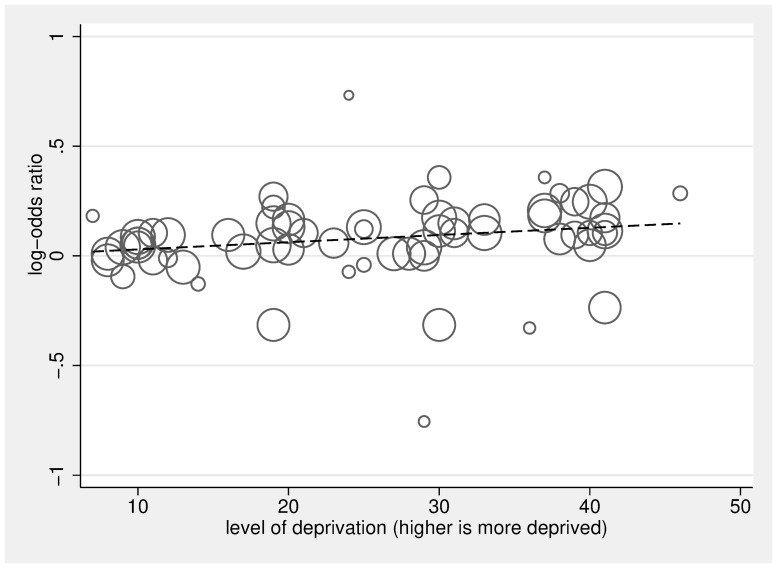
Methods and findings: MEDLINE, EMBASE, PsycINFO, CINAHL, and ASSIA databases were searched without language restrictions from inception to 1 February 2019. We included empirical observational studies from high-income countries reporting an association between SEP (e.g., income, education, occupation, private medical insurance status, housing tenure, housing quality, or area-based deprivation) and place of death, plus use of acute care, specialist and nonspecialist end-of-life care, advance care planning, and quality of care in the last year of life. Methodological quality was evaluated using the Newcastle-Ottawa Quality Assessment Scale (NOS). The overall strength and direction of associations was summarised, and where sufficient comparable data were available, adjusted odds ratios (ORs) were pooled and dose-response meta-regression performed. A total of 209 studies were included (mean NOS quality score of 4.8); 112 high- to medium-quality observational studies were used in the meta-synthesis and meta-analysis (53.5% from North America, 31.0% from Europe, 8.5% from Australia, and 7.0% from Asia). Compared to people living in the least deprived neighbourhoods, people living in the most deprived neighbourhoods were more likely to die in hospital versus home (OR 1.30, 95% CI 1.23-1.38, p < 0.001), to receive acute hospital-based care in the last 3 months of life (OR 1.16, 95% CI 1.08-1.25, p < 0.001), and to not receive specialist palliative care (OR 1.13, 95% CI 1.07-1.19, p < 0.001). For every quintile increase in area deprivation, hospital versus home death was more likely (OR 1.07, 95% CI 1.05-1.08, p < 0.001), and not receiving specialist palliative care was more likely (OR 1.03, 95% CI 1.02-1.05, p < 0.001). Compared to the most educated (qualifications or years of education completed), the least educated people were more likely to not receive specialist palliative care (OR 1.26, 95% CI 1.07-1.49, p = 0.005). The observational nature of the studies included and the focus on high-income countries limit the conclusions of this review.

Conclusions: In high-income countries, low SEP is a risk factor for hospital death as well as other indicators of potentially poor-quality end-of-life care, with evidence of a dose response indicating that inequality persists across the social stratum. These findings should stimulate widespread efforts to reduce socioeconomic inequality towards the end of life.


Conflict of interest statement

The authors have declared that no competing interests exist.

Figures

Fig 1
Fig 1. Algorithm for evaluating overall strength of evidence for each combination of SEP exposure and outcome, based on quality, quantity, and consistency of the evidence [54].
High-quality studies were those that had controlled for age and sex in a multivariable analysis and had an NOS score of ≥7. Medium quality was assigned to studies that had controlled for age and/or sex in a multivariable analysis and had an NOS score of ≥5, or had not carried out multivariable analysis but had an NOS score of ≥6. Low-quality studies had no multivariable analysis and an NOS score of ≤5, or an NOS score of ≤4. High-strength evidence required ≥70% agreement about the direction of the exposure outcome association; moderate strength evidence required ≥60% agreement. NOS, Newcastle-Ottawa Quality Assessment Scale; SEP, socioeconomic position.
Fig 2
Fig 2. PRISMA flow diagram of papers reporting numbers of included and excluded texts.
PRISMA, Preferred Reporting Items for Systematic Reviews and Meta-Analyses; SEP, socioeconomic position.
Fig 3
Fig 3. Diagram representing the strength of evidence and direction of association between measures of SEP and use of healthcare in the last year of life.
Font size of the outcomes in the centre of the circle, and circle size accompanying the SEP exposures around the circumference, are proportionate to the number of high- and medium-quality studies that the factors were reported in (see S4 Text for underlying numbers and S3 Text for details of studies, outcomes, and exposures). Strength of evidence was determined using the algorithm in Fig 1. A bolder arrow represents strong evidence and a lighter arrow moderate evidence. An arrow from exposure to outcome indicates a pro–high-SEP association such that lowest (compared to highest) SEP was associated with an adverse outcome. There was no evidence of pro–low-SEP associations. Associations with low evidence or with fewer than 4 studies are not depicted. SEP, socioeconomic position.
Fig 4
Fig 4. Association between area deprivation and: Place of death, use of acute care, and use of specialist palliative care.
Squares show ORs for the most area deprived compared to the least area deprived; diamonds show pooled effects using random-effects models. Place of death (death in hospital versus death at home/hospice/LTC), use of acute care (use of acute services last 3 months of life versus no use), and use of specialist palliative care (not accessing specialist palliative care in the last year of life versus accessing). ORs have been standardised so that >1 indicates that those living in the most deprived areas have higher odds of a worse outcome than those living in the least deprived areas. EoL, end of life; LTC, long-term care; OR, odds ratio; SEP, socioeconomic position.
Fig 5
Fig 5. Association between education and: Place of death and use of specialist palliative care.
Squares show ORs for the least educated group compared to the most educated group; diamonds show pooled effects using random-effects models. Place of death (death in hospital versus death at home/hospice/LTC) and use of specialist palliative care (not accessing specialist palliative care in the last year of life versus accessing). ORs have been standardised so that >1 indicates that the least educated have higher odds of a worse outcome than the best educated. LTC, long-term care; OR, odds ratio; SEP, socioeconomic position.
Fig 6
Fig 6. Dose analysis of area deprivation on log-odds of hospital versus home death, compared to the least deprived group.
The scatter plot in Fig 6 depicts the linear association between dose of area deprivation (0 being least deprived, 50 being most deprived) and the log-odds of death in hospital versus death at home/hospice/LTC, compared to the least area-deprived group. The circles represent the dose-specific estimates from the 20 included studies [,,,,,,,–98]; each study contributes 2, 3, or 4 circles reflecting the number of area-deprivation categories included in the study (the reference category, the least deprived group, is not plotted), and the size of the circle corresponds to the inverse of its total variance. The regression line calculated using the 2-stage glst command in Stata with random effects accounting for within-study dependence reflects a significant positive relationship between dose of area deprivation and likelihood of hospital death (for a 10× unit increase in dose β = 1.07, 95% CI 1.05–1.08, p < 0.001). LTC, long-term care.
Fig 7
Fig 7. Dose analysis of area deprivation on log-odds of not receiving specialist palliative in the last year of life versus receiving that care, compared to the least deprived group.
The scatter plot in Fig 7 depicts the linear association between dose of area deprivation (0 being least deprived, 50 being most deprived) and the log-odds of not receiving specialist palliative care, compared to the least area-deprived group. The circles represent the dose-specific estimates from the 16 included studies [,,,,,,,–109]; each study contributes 2, 3, or 4 circles reflecting the number of area-deprivation categories included in the study (the reference category, the least deprived group, is not plotted), and the size of the circle corresponds to the inverse of its total variance. The regression line calculated using the 2-stage glst command in Stata with random effects accounting for within-study dependence reflects a significant positive relationship between dose of area deprivation and likelihood of receiving specialist palliative care (for a 10× unit increase in dose β = 1.03, 95% CI 1.02–1.05, p < 0.001).

Similar articles

Cited by

References

    1. Marmot M. The health gap: The challenge of an unequal world. The Lancet. 2015;386(10011):2442–4. - PubMed
    1. Marmot M. 2010. Fair Society, Healthy Lives: The Marmot Review: strategic review of health inequalities in England post-2010.
    1. WHO. A conceptual framework for action on the social determinants of health: social determinants of health discussion paper 2. World Health Organisation, Commission on the Social Determinants of Health. 2010.
    1. De Schreye R, Houttekier D, Deliens L, Cohen J. Developing indicators of appropriate and inappropriate end-of-life care in people with Alzheimer’s disease, cancer or chronic obstructive pulmonary disease for population-level administrative databases: A RAND/UCLA appropriateness study. Palliative Medicine. 2017;31(10):932–45. 10.1177/0269216317705099 - DOI - PubMed
    1. Raziee H, Saskin R, Barbera L. Determinants of Home Death in Patients With Cancer: A Population-Based Study in Ontario, Canada. J Palliat Care. 2017;32(1):11–8. 10.1177/0825859717708518 - DOI - PubMed

Publication types

MeSH terms