. 2019 Apr 23;14(4):e0215622.
doi: 10.1371/journal.pone.0215622. eCollection 2019.

A lumped parameter model of endoplasm flow in Physarum polycephalum explains migration and polarization-induced asymmetry during the onset of locomotion

Affiliations

A lumped parameter model of endoplasm flow in Physarum polycephalum explains migration and polarization-induced asymmetry during the onset of locomotion

Christina Oettmeier et al. PLoS One. .

Abstract

The plasmodial slime mold Physarum polycephalum exhibits strong, periodic flow of cytoplasm through the veins of its network. In the special case of mesoplasmodia, a newly described starvation-induced, shape-constant morphotype, this periodic endoplasm streaming is the basis of locomotion. Furthermore, we presume that cytoplasm flow is also involved in signal transmission and signal processing. Mesoplasmodia motility resembles amoeboid locomotion. In contrast to other amoebae, however, mesoplasmodia move without extending pseudopods and retain a coherent, fan-shaped morphology throughout their steady locomotion. Attaining sizes of up to 2 mm2, mesoplasmodia are also much bigger than other amoebae. We characterize this particular type of locomotion and identify patterns of movement. By using the analogy between pulsatile fluid flow through a network of elastic tubes and electrical circuits, we build a lumped model that explains observed fluid flow patterns. Essentially, the mesoplasmodium acts as a low-pass filter, permitting only low-frequency oscillations to propagate from back to front. This frequency selection serves to optimize flow and reduces power dissipation. Furthermore, we introduce a distributed element into the lumped model to explain cell polarization during the onset of chemotaxis: Biochemical cues (internal or external) lead to a local softening of the actin cortex, which in turn causes an increased flow of cytoplasm into that area and, thus, a net forward movement. We conclude that the internal actin-enclosed vein network gives the slime mold a high measure of control over fluid transport, especially by softening or hardening, which in turn leads to polarization and net movement.


Conflict of interest statement

The authors have declared that no competing interests exist.

Figures

Fig 1
Fig 1. Mesoplasmodia migration pattern and schematic drawing.
A) Mesoplasmodia emerging from microplasmodia plated on glucose-deficient agar. Image taken 7 hours after plating. Arrows indicate star-shaped migration pattern. Scale bar = 2 mm. B) and C) Schematic representation of a mesoplasmodium. B) The three most important regions involved in locomotion: the uroid (hatched area), internal veins, and front. An explanation is provided in the text. C) Proposed mechanism of the amoeboid locomotion employed by mesoplasmodia. Contractions are generated in the uroid, whose shape (uroid angle) influences locomotion speed. The front is pushed outwards passively by the flow.
Fig 2
Fig 2. Kymograph.
A) Kymograph of the growth front of a mesoplasmodium. x = spatial dimension, t = time. Inset: single frame of a time sequence. Kymograph is taken along orange line. B) Output image of a time series (standard deviation). Yellow dashed line = first frame of time series, orange dashed line = last frame. Scale bar = 20 μm. Arrow denotes direction of migration.
Fig 3
Fig 3. Movement speed of frontal membrane.
Red dashed line = average velocity. Negative values = movement of cell contour towards center of mass. tret = membrane retraction time, text = membrane extension time.
Fig 4
Fig 4. Contour dynamics.
A) Still frame taken from a 40 minute recording of a mesoplasmodium with an obtuse angle. Scale bar = 200 μm. Arrow denotes the direction of movement. U = uroid, F = front. White arrowhead correponds to contour length 0 resp. 6000 μm in panel B. B) Velocity chart of same mesoplasmodium. Data was obtained as given in section Contour detection. Dashed lines mark points on the contour where the uroid (U) transitions into the front (F). C) Magnified detail of the front shows uniform membrane extrusion and retraction. D) Magnified detail of uroid region shows simultaneous movements in opposite directions (dashed lines) and lateral wave phenomena (arrowheads).
Fig 5
Fig 5. Frequency selection.
A) Velocity chart of uroid of mesoplasmodium. B) Velocity chart of front. Data was obtained as given in section Contour detection.
Fig 6
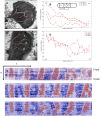
Fig 6. Flow pattern along veins.
A) Satellite with acute uroid angle (time series over 7 minutes). Veins (red) run from uroid to front. B) Cross-correlation of flow velocities along the three veins. The velocity profile of the vein segment closest to the uroid is correlated with that of every subsequent segment along the vein (see inset). The correlation decreases slightly from back to front. C) and D) Similar analysis for satellite with obtuse angle. Time series over 14.5 minutes. E-G) Kymographs (see method section Analysis of leading edge velocity) taken along three veins of the mesoplasmodium in C), denoted with numbers 4-6. x = spatial dimension (each vein is ∼ 800 μm long), t = time (∼ 15 min). Bottom edge of each kymograph corresponds to vein area close to uroid; top edge is closest to the front. Along each vein, the transition from uroidal to frontal oscillation pattern (frequency selection) can be observed: The oscillation frequency is almost twice as high closest to the uroid as near the front.
Fig 7
Fig 7. Fast Fourier transform (FFT) of mesoplasmodial oscillations.
Examples of changing frequencies of endoplasm flow throughout a mesoplasmodium (A) and differences in the oscillation pattern between frontal and uroidal membrane (B). Arrows denote direction of movement. A) Data obtained from optical flow analysis. Blue denotes a segment in the back of the mesoplasmodium, red is a segment closer to the front. Whereas a frequency with a period of 1.14 min can be detected everywhere along the length of the vein (although getting less pronounced further away from the uroid), the higher frequency also present in the uroid (0.57 min) is filtered out towards the front. The mesoplasmodium as a whole shows area oscillations with a period of 0.62 min. B) Red = oscillations of the frontal membrane. Blue = oscillations of the uroidal membrane (see white boxes). Data obtained from kymographs.
Fig 8
Fig 8. Schematic of a three-element Windkessel equivalent circuit.
A) Schematic drawing of a tube segment of an internal vein. a0 = radius, Cf = fluidic capacitance, Rf = fluidic resistance. R2 = leakage due to permeable ‘walls’. B) Schematic drawing of RC circuit. The blue box (denoted with Z) represents the impedance of one singele 3-element Windkessel (see Fig 9). Uin(t) = input voltage signal, R1 = resistance due to internal friction of the cytoplasm, R2 = resistance due to leakage through vessel wall, Ce = electric capacitor, I = current.
Fig 9
Fig 9. Modeling internal veins as an equivalent electrical circuit.
A) Time series (standard deviation) of a mesoplasmodial internal vein network. Scale bar = 50 μm. B) Model of branching vein. Each branch has its own characteristic length, radius and resulting fluidic resistance and capacitance. C) The branching vein, drawn as an electrical circuit. It consists of 4 single 3-element Windkessels (Z1—Z4).
Fig 10
Fig 10. Phase difference between pressure and flow.
Pressure (Δp(t)) and flow rate (q(t)). Flow lags θ = 62° behind the pressure wave.
Fig 11
Fig 11. Dependence of phase angle, flow amplitude, power dissipation and impedance on the dimensionless parameters r˜ and c˜.
Illustration of how θrel (A), amplitude of the flow q˜ (B), power dissipation W (C), and impedance Z (D) vary with the dimensionless parameters r˜ and c˜. Red dots = local minima, blue dots = local maxima, black dots = corresponding values for calculated r˜ and c˜.
Fig 12
Fig 12. LTSpice schematic and resulting Bode plot of a three-element Windkessel.
A) Schematic of 3-element Windkessel. U = voltage source, R1, R2 = resistors, C = capacitor. Green arrow = node 1, blue arrow = node 2. B) Bode plot of the circuit, taken at node 2. The cut-off frequency can be obtained mathematically, or it can be found from the Bode plot at the frequency where the gain falls below—3 dB.
Fig 13
Fig 13. LTSpice schematic and resulting Bode plot of four three-element Windkessel.
A) LTSpice schematic of four cascaded 3WK elements. U = voltage source, R = resistor, C = capacitor. B) Bode plots obtained at positions 1 (green), 2 (blue), and 3 (red). The more segments are added, the steeper does the filter cutoff become. Solid lines = magnitude [dB], dashed lines = phase [°].
Fig 14
Fig 14. Input voltage and currents at three different positions; voltage at different positions.
A) Input voltage (blue curve) and current through R1 (green curve), R3 (red curve), and R7 (orange curve), respectively. B) Voltage measured at positions 1 (green), 2 (blue), and 3 (red). Input voltage = black curve.
Fig 15
Fig 15. Flow velocity at different positions along a vein.
A) Time series (standard deviation) of a mesoplasmodium with a major vein highlighted in red. Blue and red arrowheads denote positions at which internal flow was measured. B) Flow velocity at the two indictated positons in A along a forward moving mesoplasmodium.
Fig 16
Fig 16. Case 1: Stationary, unpolarized microplasmodium.
A) Stationary, unpolarized microplasmodium. Scale bar = 100 μm. B) Symmetrical model circuit for an oscillating but stationary microplasmodium. C = capacitors, R = resistors, U = voltage source, I = current, N = node. C) Current flowing through the right side as taken at R1 and R3 (blue) and the voltage source (IU, orange).
Fig 17
Fig 17. Case 2: Polarized, migrating plasmodium.
A) Migrating, polarized microplasmodium. Scale bar = 50 μm. B) Symmetrical model circuit for a motile microplasmodium. C = capacitors, R = resistors, U = voltage source, I = current. C) Current flowing through the right side as taken at R1 (blue) and the left side as taken at R3 (green), and current flowing through the voltage source (IU, orange).
Fig 18
Fig 18. Volumetric flow rates and micromorphology in a migrating mesoplasmodium.
A) Migrating mesoplasmodium. Scale bar = 200 μm. Overlay of two images taken at an interval of ∼ 3 min. From the solid red area, we calculated the overall volumetric flow rate (which corresponds to IU). Red diamonds designate points on main internal veins at which flow rates were measured and which correspond to IR1. Hatched area indicates frontal sheet. B) Higher resolution of the front of a migrating mesoplasmodium. Scale bar = 50 μm. White arrows point to membrane folds, black arrows to blebs.

Similar articles

Cited by

References

    1. Baranowski Z, Wohlfarth-Bottermann KE. Endoplasmic veins from plasmodia of Physarum polycephalum: a new strand model defined age, structure, and behavior. Eur J Cell Biol. 1982. April;27(1):1–9. - PubMed
    1. Alim K, Amselem G, Peaudecerf F, Brenner MP, Pringle A. Random network peristalsis in Physarum polycephalum organizes fluid flow across an individual. Proc Natl Acad Sci USA. 2013. August;110(33):13306–13311. 10.1073/pnas.1305049110 - DOI - PMC - PubMed
    1. Lewis OL, Zhang S, Guy RD, del Álamo JC. Coordination of contractility, adhesion and flow in migrating Physarum amoebae. J R Soc Interface. 2015. 12(106):20141359; 10.1098/rsif.2014.1359 - DOI - PMC - PubMed
    1. Rieu J-P, Delanoë-Ayari H, Takagi S, Tanaka Y, Nakagaki T. Periodic traction in migrating large amoeba of Physarum polycephalum. J R Soc Interface. 2015. 12(106):20150099; 10.1098/rsif.2015.0099 - DOI - PMC - PubMed
    1. Takamatsu A, Takaba E, Takizawa G. Environment-dependent morphology in plasmodium of true slime mold Physarum polycephalum and a network growth model. J Theor Biol. 2009. January 7;256(1):29–44. 10.1016/j.jtbi.2008.09.010 - DOI - PubMed