

An Investigation on Glucuronidation Metabolite Identification, Isozyme Contribution, and Species Differences of GL-V9 In Vitro and In Vivo
- PMID: 31013570
- PMCID: PMC6515479
- DOI: 10.3390/molecules24081576
An Investigation on Glucuronidation Metabolite Identification, Isozyme Contribution, and Species Differences of GL-V9 In Vitro and In Vivo
Abstract
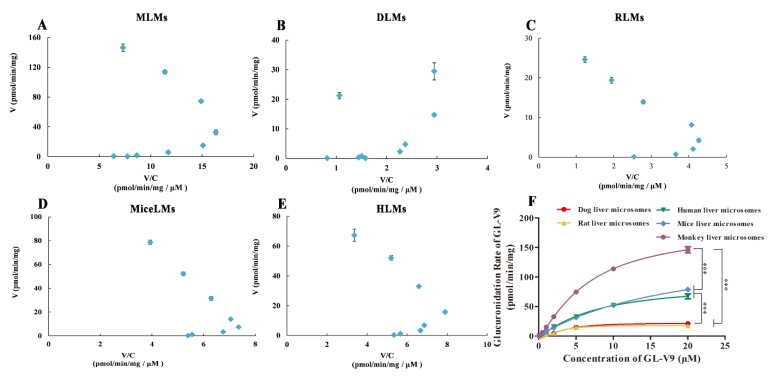
GL-V9 is a prominent derivative of wogonin with a wide therapeutic spectrum and potent anti-tumor activity. The metabolism characteristics of GL-V9 remain unclear. This study aimed to clarify the metabolic pathway of GL-V9 and investigate the generation of its glucuronidation metabolites in vitro and in vivo. HPLC-UV-TripleTOF was used to identify metabolites. The main metabolite that we found was chemically synthesized and the synthetic metabolite was utilized as standard substance for the subsequent metabolism studies of GL-V9, including enzyme kinetics in liver microsomes of five different species and reaction phenotyping metabolism using 12 recombinant human UDP-glucuronosyltransferase (UGT) isoforms. Results indicated that the glucuronidation reaction occurred at C5-OH group, and 5-O-glucuronide GL-V9 is the only glucuronide metabolite and major phase II metabolite of GL-V9. Among 12 recombinant human UGTs, rUGT1A9 showed the strongest catalytic capacity for the glucuronidation reaction of GL-V9. rUGT1A7 and rUGT1A8 were also involved in the glucuronidation metabolism. Km of rUGT1A7-1A9 was 3.25 ± 0.29, 13.92 ± 1.05, and 4.72 ± 0.28 μM, respectively. In conclusion, 5-O-glucuronide GL-V9 is the dominant phase II metabolite of GL-V9 in vivo and in vitro, whose formation rate and efficiency are closely related to isoform-specific metabolism profiles and the distribution of UGTs in different tissues of different species.
Keywords: GL-V9; enzyme kinetics; glucuronidation; human recombinant UGTs.
Conflict of interest statement
The authors have no potential conflicts of interest to declare.
Figures


Similar articles
-
In vitro characterization of glucuronidation of vanillin: identification of human UDP-glucuronosyltransferases and species differences.Phytother Res. 2013 Sep;27(9):1392-7. doi: 10.1002/ptr.4885. Epub 2012 Nov 26. Phytother Res. 2013. PMID: 23184728
-
Regioselective glucuronidation of andrographolide and its major derivatives: metabolite identification, isozyme contribution, and species differences.AAPS J. 2015 Jan;17(1):156-66. doi: 10.1208/s12248-014-9658-8. Epub 2014 Sep 10. AAPS J. 2015. PMID: 25204783 Free PMC article.
-
In vitro glucuronidation of the primary metabolite of 10-chloromethyl-11-demethyl-12-oxo-calanolide A by human liver microsomes and its interactions with UDP-glucuronosyltransferase substrates.Drug Metab Pharmacokinet. 2015 Feb;30(1):89-96. doi: 10.1016/j.dmpk.2014.09.007. Epub 2014 Oct 5. Drug Metab Pharmacokinet. 2015. PMID: 25760535
-
UDP-glucuronosyltransferase-mediated metabolic activation of the tobacco carcinogen 2-amino-9H-pyrido[2,3-b]indole.J Biol Chem. 2012 Apr 27;287(18):14960-72. doi: 10.1074/jbc.M111.320093. Epub 2012 Mar 5. J Biol Chem. 2012. PMID: 22393056 Free PMC article.
-
Use of isoform-specific UGT metabolism to determine and describe rates and profiles of glucuronidation of wogonin and oroxylin A by human liver and intestinal microsomes.Pharm Res. 2010 Aug;27(8):1568-83. doi: 10.1007/s11095-010-0148-0. Epub 2010 Apr 22. Pharm Res. 2010. PMID: 20411407 Free PMC article.
Cited by
-
Trace quantification of GL-V9 and its glucuronide metabolites (5-O-glucuronide GL-V9) in Beagle dog plasma by UPLC-MS/MS and its application to a pharmacokinetic study.PLoS One. 2023 Jun 7;18(6):e0286467. doi: 10.1371/journal.pone.0286467. eCollection 2023. PLoS One. 2023. PMID: 37285365 Free PMC article.
-
Current biological and pharmacological updates on wogonin.EXCLI J. 2020 May 13;19:635-640. eCollection 2020. EXCLI J. 2020. PMID: 32536834 Free PMC article. No abstract available.
-
Pharmacokinetics of B-Ring Unsubstituted Flavones.Pharmaceutics. 2019 Aug 1;11(8):370. doi: 10.3390/pharmaceutics11080370. Pharmaceutics. 2019. PMID: 31374885 Free PMC article. Review.
References
-
- Middleton E. Effect of Plant Flavonoids on Immune and Inflammatory Cell Function. In: Manthey J.A., Buslig B.S., editors. Flavonoids in the Living System. Volume 439. Springer; Boston, MA, USA: 1998. pp. 175–182. - PubMed
-
- Pyrzynska K., Biesaga M. Analysis of phenolic acids and flavonoids in honey. TrAC Trends Anal. Chem. 2009;28:893–902. doi: 10.1016/j.trac.2009.03.015. - DOI
-
- Singh P., Jain S., Bhala M., Goyal R.B., Jayaprakash D., Lohiya N.K. Wogonin, 5,7-dihydroxy-8-methoxyflavone as oestrogenic and anti-implantational agent in the rat. Phytother. Res. 1990;4:86–89. doi: 10.1002/ptr.2650040303. - DOI
MeSH terms
Substances
Grants and funding
LinkOut - more resources
Full Text Sources
Miscellaneous
