

Physiological Performance Measures as Indicators of CrossFit® Performance
- PMID: 31013585
- PMCID: PMC6524377
- DOI: 10.3390/sports7040093
Physiological Performance Measures as Indicators of CrossFit® Performance
Abstract
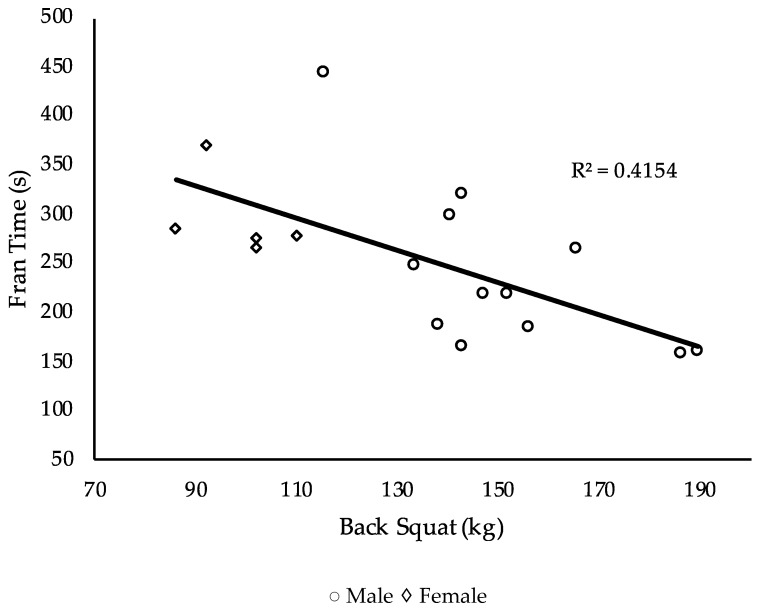
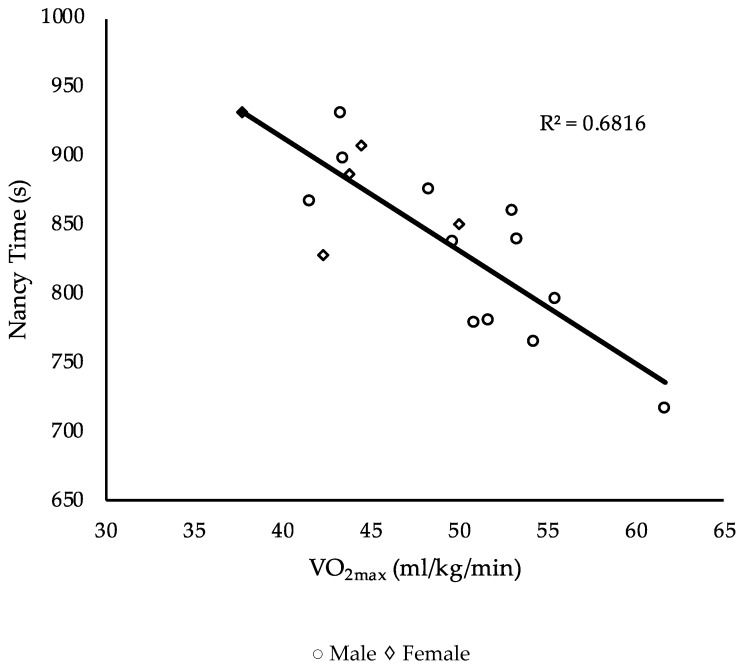
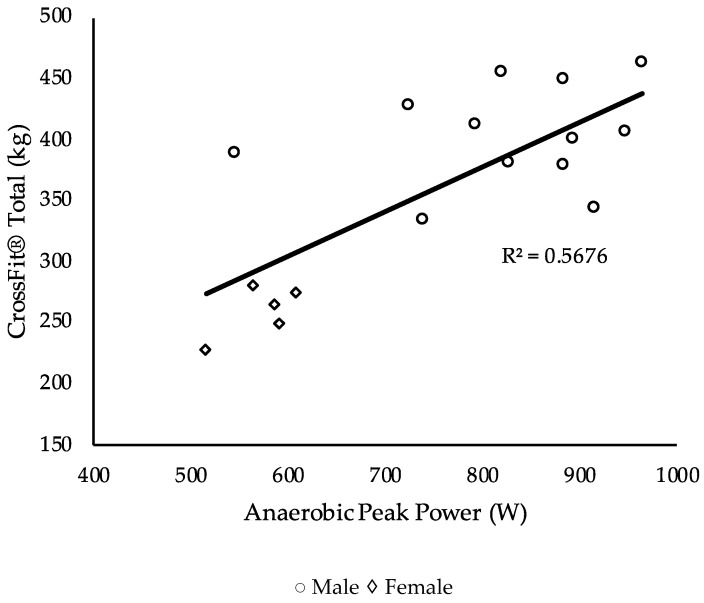
CrossFit® began as another exercise program to improve physical fitness and has rapidly grown into the "sport of fitness". However, little is understood as to the physiological indicators that determine CrossFit® sport performance. The purpose of this study was to determine which physiological performance measure was the greatest indicator of CrossFit® workout performance. Male (n = 12) and female (n = 5) participants successfully completed a treadmill graded exercise test to measure maximal oxygen uptake (VO2max), a 3-minute all-out running test (3MT) to determine critical speed (CS) and the finite capacity for running speeds above CS (D'), a Wingate anaerobic test (WAnT) to assess anaerobic peak and mean power, the CrossFit® total to measure total body strength, as well as the CrossFit® benchmark workouts: Fran, Grace, and Nancy. It was hypothesized that CS and total body strength would be the greatest indicators of CrossFit® performance. Pearson's r correlations were used to determine the relationship of benchmark performance data and the physiological performance measures. For each benchmark-dependent variable, a stepwise linear regression was created using significant correlative data. For the workout Fran, back squat strength explained 42% of the variance. VO2max explained 68% of the variance for the workout Nancy. Lastly, anaerobic peak power explained 57% of the variance for performance on the CrossFit® total. In conclusion, results demonstrated select physiological performance variables may be used to predict CrossFit® workout performance.
Keywords: CrossFit® sport performance; D′; VO2max; benchmark performance; critical speed; physiological indicators; strength.
Conflict of interest statement
The authors declare no conflict of interest.
Figures
References
-
- CrossFit® About the Games. [(accessed on 23 January 2018)]; Available online: https://games.crossfit.com/about-the-games.
-
- Glassman G. Understanding Crossfit. Crossfit J. 2007;56:1.
-
- Paine J., Uptgraft J., Wylie R. CrossFit study. Commond Gen. Staff Coll. 2010;1:1–34.
-
- Murawska-Cialowicz E., Wojna J., Zuwala-Jagiello J. Crossfit training changes brain-derived neurotrophic factor and irisin levels at rest, after wingate and progressive tests, and improves aerobic capacity and body composition of young physically active men and women. J. Physiol. Pharmacol. 2015;66:811–821. - PubMed
LinkOut - more resources
Full Text Sources
