. 2019 May;18(9):1033-1044.
doi: 10.1080/15384101.2019.1610241. Epub 2019 May 1.

Transcription elements AREB6 and miR-34a affect apoptosis of PAMs by regulating the expression of SS2-related gene PPP1R11

Affiliations

Transcription elements AREB6 and miR-34a affect apoptosis of PAMs by regulating the expression of SS2-related gene PPP1R11

Guisheng Liu et al. Cell Cycle. 2019 May.

Abstract

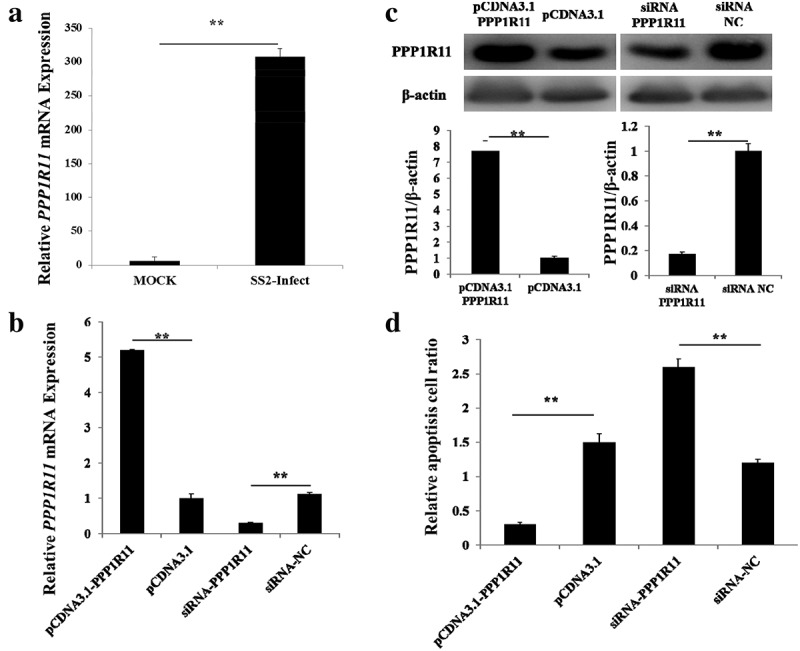
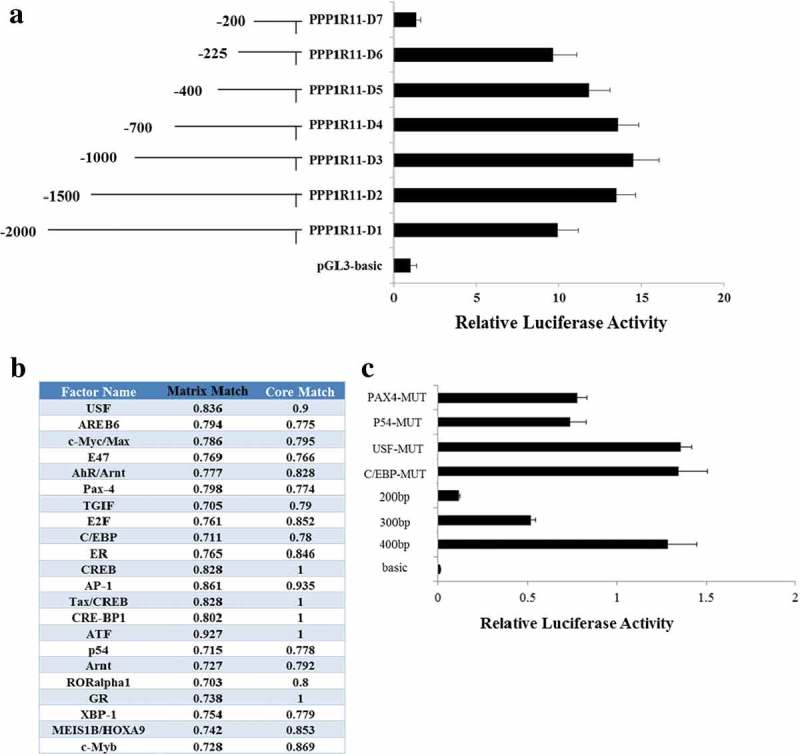
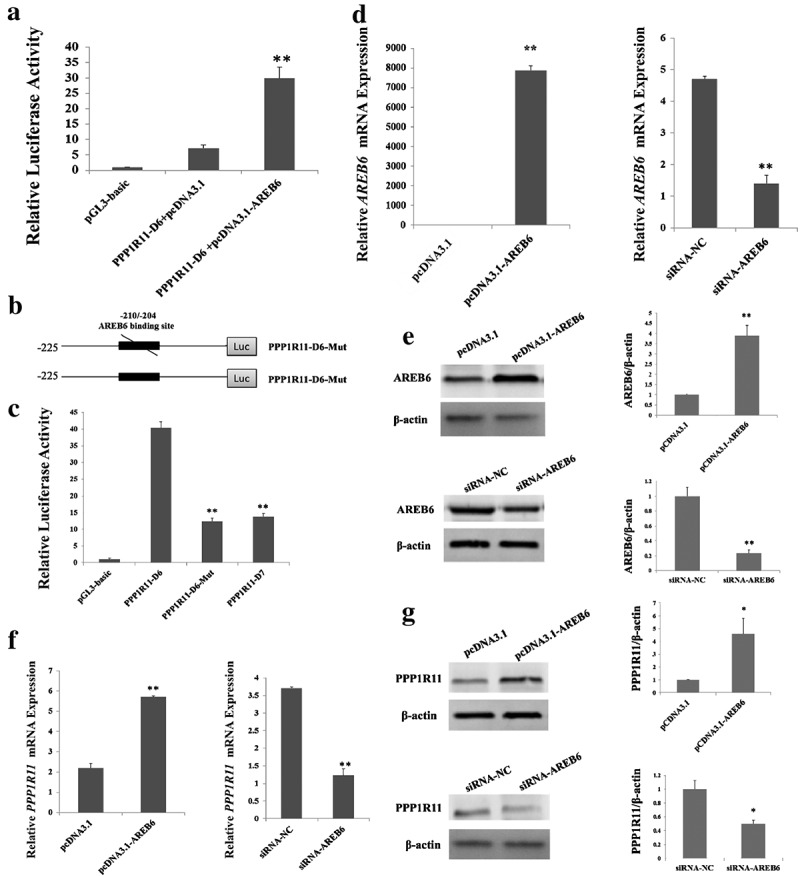
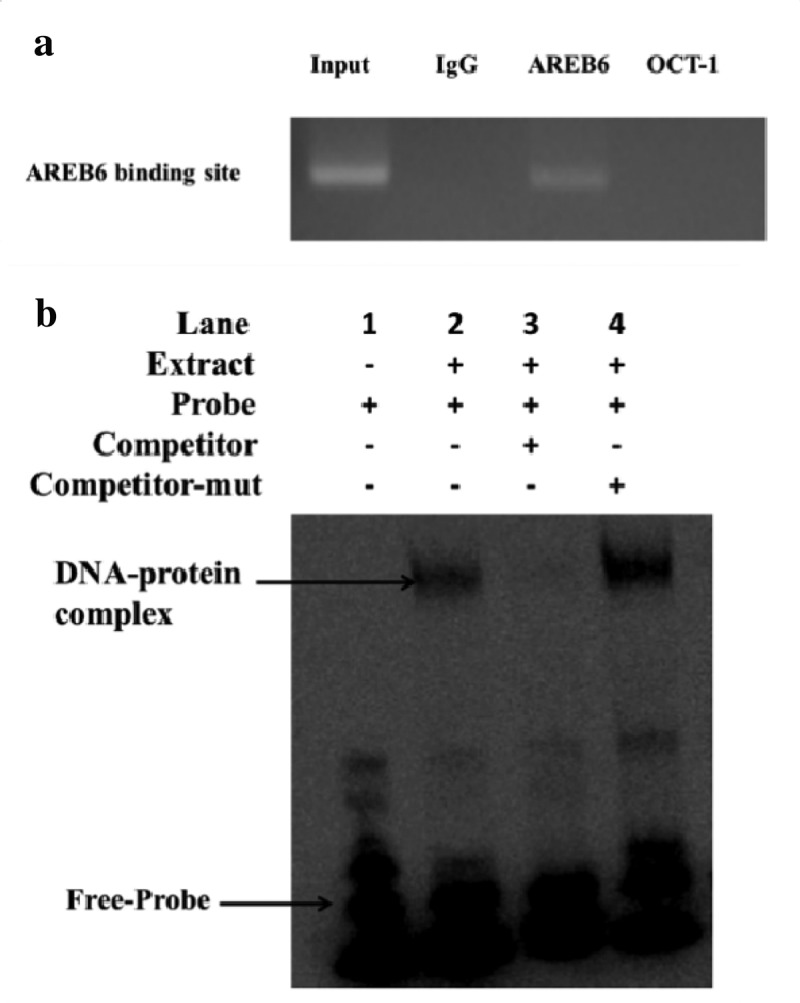
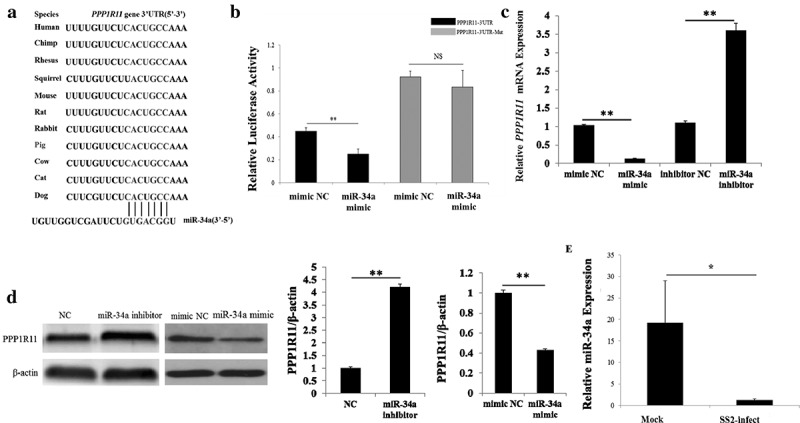
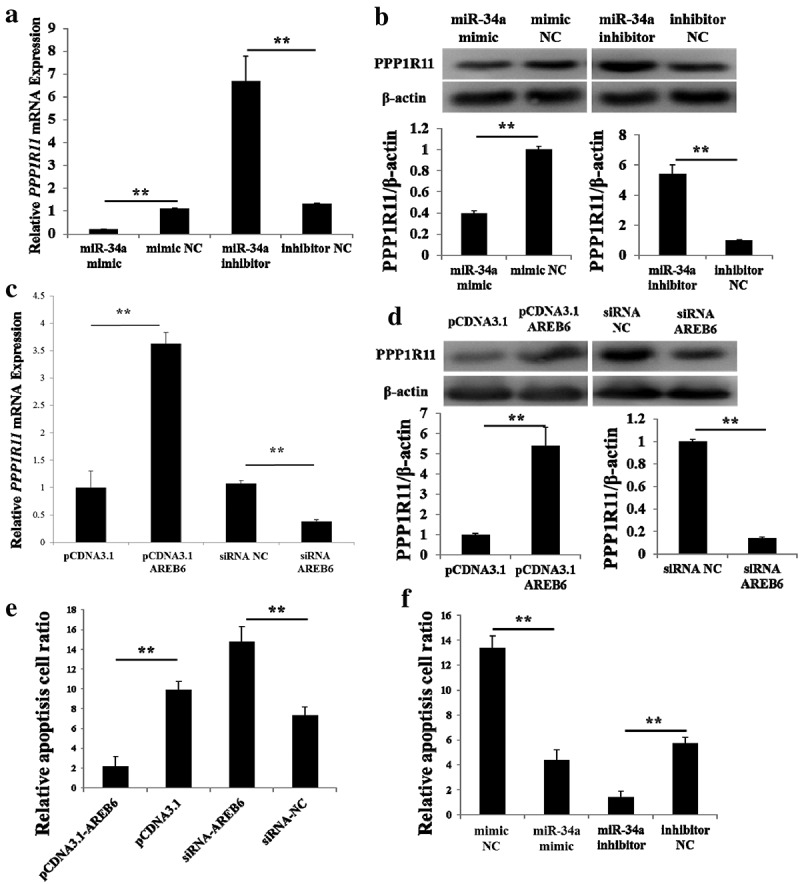
In our previous work, gene PPP1R11 (protein phosphatase 1 regulatory subunit 11) was significantly expressed in pigs after Streptococcus suis 2 (SS2) challenged. This study firstly confirmed that SS2 induced significant expression of PPP1R11 gene in porcine alveolar macrophage (PAM) cells, and apoptosis of PAM cells were observed. After that, the core promoter of porcine PPP1R11 was identified and its transcription factor AREB6 which significantly regulated PPP1R11. We also characterized that the PPP1R11 gene is a target of miR-34a. Further, we found that PPP1R11 helped to inhibit apoptosis of PAM cells under SS2 infecting, through transcription factor AREB6 was negatively correlated with apoptosis whereas miR-34a was positively correlated. Those findings provide a functional connection among the transcription factor AREB6, miR-34a, PPP1R11 gene and apoptosis of PAM cells in the pathogenesis of the SS2 infection.

Keywords: AREB6; Porcine alveolar macrophage; apoptosis; miR-34a.


Figures

Figure 1.
Figure 1.
PPP1R11 regulated the apoptosis of porcine alveolar macrophage (PAM) cells. (a) PPP1R11 mRNA levels were detected at 24 h after being challenged with SS2 (0.5 moi). (b) qPCR was used to detect PPP1R11 in PAM cells at 24 h after transfection with pcDNA3.1-PPP1R11, and pcDNA3.1 as control; with siRNA-PPP1R11, and siRNA NC, respectively. (c) Western blot and a densitometric analysis using software imageJ to detect PPP1R11 protein levels at 48 h after PAM cells transfection. (d) PAMs were transfected with pcDNA3.1-PPP1R11, pcDNA3.1, siRNA-PPP1R11 or siRNA negative control (NC), harvested and stained with anti-annexin V-propidium iodide, and analyzed by FACS at 48 h post transfection. The results were expressed as the mean ± S.E.M. (three independent replicates per group). ** p < 0.01.
Figure 2.
Figure 2.
Determination of the core promoter of PPP1R11 gene. (a) This shows the luciferase activity changes with the seven deletion fragments in PK cells. The left panel shows the name of pGL3-based vector for each deletion mutant. The right panel indicates the relative activities of these deletion constructs. Luciferase activity was analyzed at 24 h after transfection. (b) Prediction results of the transcription factor for the PPP1R11 core promoter by software BIOBASE. (c) Luciferase activities of the four candidate transcription factors-USP, p54, C/EBP and PAX4-through point mutation of their binding site of the PPP1R11 core promoter.
Figure 3.
Figure 3.
Verification of the binding effect of AREB6 on the PPP1R11 core promoter region. (a) Luciferase activity was analyzed at 24 h after PK cells were transfected with pGL3-basic; PPP1R11-D6 + pcDNA3.1; and PPP1R11-D6 + pcDNA3.1-AREB6 constructs. (b, c) Point mutation in the AREB6-binding sites of the PPP1R11 promoter; luciferase activity was analyzed at 24 h after transfection. (d) qPCR was used to detect AREB6 at 24 h after PK cells transfected with pcDNA3.1-AREB6, pcDNA3.1 as control; siRNA-AREB6, and siRNA NC, respectively. (e) Western blot and a densitometric analysis by using software imageJ to detect AREB6 protein levels in PK cells at 48 h after transfection. (f) qPCR was used to detect PPP1R11 mRNA levels at 24 h posttransfection in PK cells. (g) Western blot and densitometric analysis using software imageJ showed PPP1R11 protein levels at 48 h after PK cells transfection. The results are expressed as the mean ± S.E.M. (three independent replicates per group). ** p < 0.01.
Figure 4.
Figure 4.
ChIP and EMSA showed that AREB6 could bind to the PPP1R11 promoter. (a) ChIP assay. The DNA fragments interacting with AREB6 protein were pulled down by anti-HA antibodies. DNA isolated from immunoprecipitated material was amplified by PCR. The “Input” was the positive control, “IgG” and “OCT1” were the negative control group, and “AREB6” was the experimental group. Agarose gel electrophoresis showed that the DNA fragments were distributed in a range of 200–1000 bp and reached the ChIP test requirement. Total chromatin was used as the input. (b) EMSAs. Lane 1 is a negative control which only added the 5′ biotin-labeled probe containing the AREB6 binding site. Therefore, only the band of the free probe was shown. In contrast, lane 2 is the experiment group, which added the 5′ biotin-labeled probe containing the AREB6 binding site, and simultaneously added the nuclear extraction matters, where the moving band of the DNA- and nucleoprotein-complex could not be seen; lane 3 and lane 4 were both experimental controls. Lane 3 added the 50 × 5′ unlabeled probe containing the AREB6 binding site to competitively bind the AREB6 protein, so there was no band of the DNA- and protein-complex, whereas lane 4 added the 5′ unlabeled probe containing the AREB6 binding site that had been mutated, and therefore it still was able to observe the migration bands of the DNA- and protein-complex. The specific DNA-protein complex and DNA-protein-antibody complex bands are indicated by arrows.
Figure 5.
Figure 5.
Verification of miR-34a targeting PPP1R11. (a) miR-34a binding site sequences in the PPP1R11 3′-UTR in 11 different species. (b) Luciferase activity was analyzed in PK cells at 24 h after co-transfected with pmiRGLO-PPP1R11-3′-UTR or pmiRGLO-PPP1R11-3′-UTR-Mut and miR-34a mimics or NC mimics. pmirGLO-PPP1R11-3′ UTR luciferase reporter gene with the miR-34a mimic or NC were co-transfected into PK cells; the results showed the miR-34a significantly inhibited luciferase activity. On the contrary, miR-34a had no significant effect on the dual luciferase activity when PPP1R11 3′-UTR was mutated. (c, d): Detection effect of miR-34a on PPP1R11. qPCR and Western Blot analysis were used to detect PPP1R11 mRNA levels and protein levels after PK cells were transfected with miR-34a mimics, NC mimics, miR-34a inhibitor, and inhibitor NC, respectively. Then, a densitometric analysis of by software imageJ. (e) qPCR was used to detect miR-34a levels at 24 h after PAM cells were infected with SS2 (0.5 moi). The results are expressed as the mean ± S.E.M. (three independent replicates per group). * p < 0.05; ** p < 0.01.
Figure 6.
Figure 6.
miR-34a and AREB6 regulate the apoptosis of PAM cells by PPP1R11. (a) qPCR was used to detect PPP1R11 in PAM cells at 24 h after transfected with miR-34a mimics, NC mimics, miR-34a inhibitor or NC inhibitor. (b) Western blot and a densitometric analysis by using software imageJ to detect PPP1R11 protein levels in PAM cells at 48 h after transfected with miR-34a mimics, NC mimics, miR-34a inhibitor or NC inhibitor. (c) qPCR was used to detect PPP1R11 in PAM cells at 24 h after transfected with pcDNA3.1-AREB6, pcDNA3.1, siRNA-AREB6 or siRNA NC. (d) Western blot and a densitometric analysis by using software imageJ to detect PPP1R11 protein levels in PAM cells at 48 h after transfected with pcDNA3.1-AREB6, pcDNA3.1, siRNA-AREB6 or siRNA NC. (e) The PAMs were transfected with pcDNA3.1-AREB6, pcDNA3.1, siRNA-AREB6 or siRNA NC, were harvested at 48 h and stained with anti-annexin V-propidium iodide, and then analyzed by FACS. (f) The PAMs were transfected with miR-34a mimics, NC mimics, miR-34a inhibitor or NC inhibitor, and harvested at 48 h and stained with anti-annexin V-propidium iodide, and then analyzed by FACS. The results are expressed as the mean ± S.E.M. (three independent replicates per group). * p < 0.05; ** p < 0.01.

Similar articles

References

    1. Goyette-Desjardins G, Auger JP, Xu J, et al. Streptococcus suis, an important pig pathogen and emerging zoonotic agent-an update on the worldwide distribution based on serotyping and sequence typing. Emerg Microbes Infect. 2014;3:e45. - PMC - PubMed
    1. Khan US, Atanasova KR, Krueger WS, et al Epidemiology, geographical distribution, and economic consequences of swine zoonoses: a narrative review. Emerg Microbes Infect. 2013;2:e92. - PMC - PubMed
    1. Gaur U, Xiong YY, Luo QP, et al. Breed-specific transcriptome response of spleen from six to eight week old piglet after infection with Streptococcus suis type 2. Mol Biol Rep. 2014;41:7865–7873. - PubMed
    1. Moorhead GB, Trinkle-Mulcahy L, Ulke-Lemee A.. Emerging roles of nuclear protein phosphatases. Nat Rev Mol Cell Biol. 2007;8:234–244. - PubMed
    1. Ceulemans H, Bollen M.. Functional diversity of protein phosphatase-1, a cellular economizer and reset button. Physiol Rev. 2004;84:1–39. - PubMed

Publication types

MeSH terms

Substances

LinkOut - more resources