

The distribution of epistasis on simple fitness landscapes
- PMID: 31014191
- PMCID: PMC6501363
- DOI: 10.1098/rsbl.2018.0881
The distribution of epistasis on simple fitness landscapes
Abstract
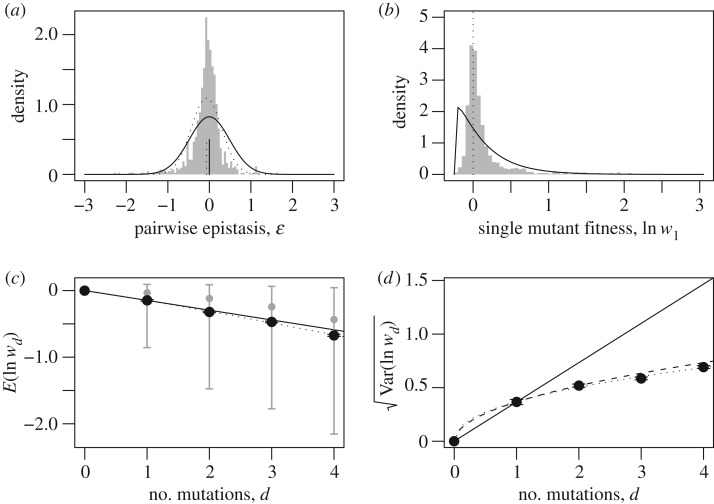
Fitness interactions between mutations can influence a population's evolution in many different ways. While epistatic effects are difficult to measure precisely, important information is captured by the mean and variance of log fitnesses for individuals carrying different numbers of mutations. We derive predictions for these quantities from a class of simple fitness landscapes, based on models of optimizing selection on quantitative traits. We also explore extensions to the models, including modular pleiotropy, variable effect sizes, mutational bias and maladaptation of the wild type. We illustrate our approach by reanalysing a large dataset of mutant effects in a yeast snoRNA (small nucleolar RNA). Though characterized by some large epistatic effects, these data give a good overall fit to the non-epistatic null model, suggesting that epistasis might have limited influence on the evolutionary dynamics in this system. We also show how the amount of epistasis depends on both the underlying fitness landscape and the distribution of mutations, and so is expected to vary in consistent ways between new mutations, standing variation and fixed mutations.
Keywords: Fisher’s geometric model; Saccharomyces cerevisiae; fitness landscapes; genetic interactions.
Conflict of interest statement
We declare no competing interests.
Figures
Similar articles
-
Negative Epistasis in Experimental RNA Fitness Landscapes.J Mol Evol. 2017 Dec;85(5-6):159-168. doi: 10.1007/s00239-017-9817-5. Epub 2017 Nov 10. J Mol Evol. 2017. PMID: 29127445 Review.
-
Properties of selected mutations and genotypic landscapes under Fisher's geometric model.Evolution. 2014 Dec;68(12):3537-54. doi: 10.1111/evo.12545. Epub 2014 Nov 17. Evolution. 2014. PMID: 25311558 Free PMC article.
-
The Nonstationary Dynamics of Fitness Distributions: Asexual Model with Epistasis and Standing Variation.Genetics. 2016 Dec;204(4):1541-1558. doi: 10.1534/genetics.116.187385. Epub 2016 Oct 21. Genetics. 2016. PMID: 27770037 Free PMC article.
-
A systematic survey of an intragenic epistatic landscape.Mol Biol Evol. 2015 Jan;32(1):229-38. doi: 10.1093/molbev/msu301. Epub 2014 Nov 3. Mol Biol Evol. 2015. PMID: 25371431 Free PMC article.
-
Global epistasis on fitness landscapes.Philos Trans R Soc Lond B Biol Sci. 2023 May 22;378(1877):20220053. doi: 10.1098/rstb.2022.0053. Epub 2023 Apr 3. Philos Trans R Soc Lond B Biol Sci. 2023. PMID: 37004717 Free PMC article. Review.
Cited by
-
Systematic conformation-to-phenotype mapping via limited deep-sequencing of proteins.ArXiv [Preprint]. 2023 Jan 30:arXiv:2204.06159v2. ArXiv. 2023. Update in: Mol Cell. 2023 Jun 1;83(11):1936-1952.e7. doi: 10.1016/j.molcel.2023.05.006. PMID: 36776823 Free PMC article. Updated. Preprint.
-
Fisher's Geometric Model as a Tool to Study Speciation.Cold Spring Harb Perspect Biol. 2024 Jul 1;16(7):a041442. doi: 10.1101/cshperspect.a041442. Cold Spring Harb Perspect Biol. 2024. PMID: 38253415 Free PMC article. Review.
-
Systematic conformation-to-phenotype mapping via limited deep sequencing of proteins.Mol Cell. 2023 Jun 1;83(11):1936-1952.e7. doi: 10.1016/j.molcel.2023.05.006. Mol Cell. 2023. PMID: 37267908 Free PMC article.
-
The geometry and genetics of hybridization.Evolution. 2020 Dec;74(12):2575-2590. doi: 10.1111/evo.14116. Epub 2020 Nov 23. Evolution. 2020. PMID: 33150956 Free PMC article.
-
Phenotypic and genotypic parallel evolution in parapatric ecotypes of Senecio.Evolution. 2021 Dec;75(12):3115-3131. doi: 10.1111/evo.14387. Epub 2021 Nov 8. Evolution. 2021. PMID: 34687472 Free PMC article.
References
-
- Lewontin RC. 1974. The genetic basis of evolutionary change. New York, NY: Columbia University Press.
Publication types
MeSH terms
Associated data
LinkOut - more resources
Full Text Sources
Molecular Biology Databases
