. 2019 Apr 24;286(1901):20190184.
doi: 10.1098/rspb.2019.0184.

Silicified cell walls as a defensive trait in diatoms

Affiliations

Silicified cell walls as a defensive trait in diatoms

Marina Pančić et al. Proc Biol Sci. .

Abstract

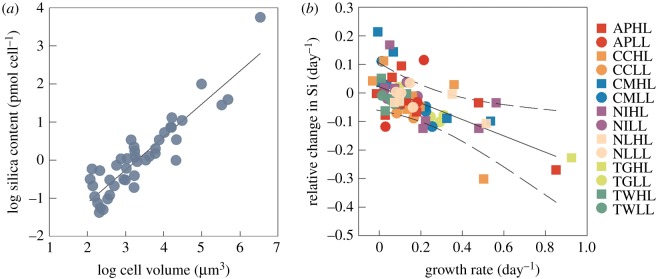
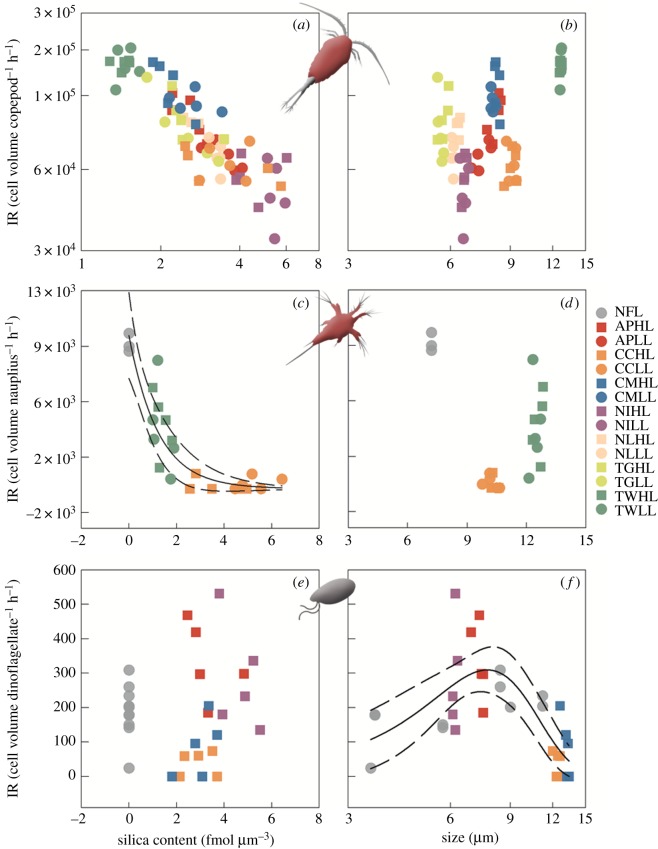
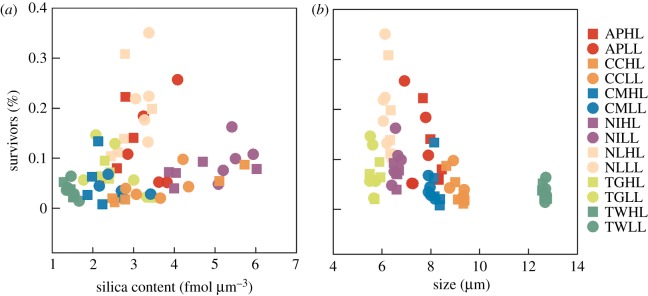
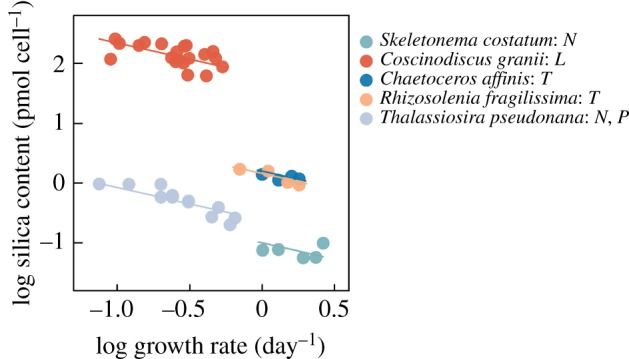
Diatoms contribute nearly half of the marine primary production. These microalgae differ from other phytoplankton groups in having a silicified cell wall, which is the strongest known biological material relative to its density. While it has been suggested that a siliceous wall may have evolved as a mechanical protection against grazing, empirical evidence of its defensive role is limited. Here, we experimentally demonstrate that grazing by adult copepods and nauplii on diatoms is approximately inversely proportional to their silica content, both within and among diatom species. While a sixfold increase in silica content leads to a fourfold decrease in copepod grazing, silicification provides no protection against protozoan grazers that directly engulf their prey. We also found that the wall provides limited protection to cells ingested by copepods, since less than 1% of consumed cells were alive in the faecal pellets. Moreover, silica deposition in diatoms decreases with increasing growth rates, suggesting a possible cost of defence. Overall, our results demonstrate that thickening of silica walls is an effective defence strategy against copepods. This suggests that the plasticity of silicification in diatoms may have evolved as a response to copepod grazing pressure, whose specialized tools to break silicified walls have coevolved with diatoms.

Keywords: diatoms; mechanical defence; silica wall; traits and trade-offs; zooplankton grazing.


Conflict of interest statement

We declare we have no competing interests.

Figures

Figure 1.
Figure 1.
(a) Log–log relationship between biogenic silica content (pmol cell−1) and cell volume (µm3). The regression line is log(Si) = 0.87 log(V) – 2.89 (r2 = 0.84; p < 0.05). Data are from this study (average silica content and cell volume of diatoms grown under high light conditions) and [,–40]. (b) Relationship between relative change in biogenic silica content (SiR; d−1) and growth rate (GR; d−1). The regression line (with 95% confidence limits) is SiR = –0.29GR + 0.02 (r2 = 0.6; p < 0.05). Details about experimental organisms are provided in table 1. HL, high light conditions; LL, low light conditions. (Online version in colour.)
Figure 2.
Figure 2.
(a) Log–log relationship between copepod ingestion rate (IR; cell volume copepod−1 h−1) and biogenic silica content (Si; fmol µm−3), and (b) between copepod ingestion rate and cell size (size; µm). See table 2 for the model selection. (c) Relationship between nauplii ingestion rate (IR; cell volume nauplius−1 h−1) and biogenic silica content (Si; fmol µm−3). A nonlinear regression was fitted to the silica range: IR = 19360 × exp(−0.81Si) [r2 = 0.71; p < 0.05]; long-dashed lines are 95% confidence intervals. (d) Relationship between nauplii ingestion rate and cell size (size; µm) (p > 0.05). (e) Relationship between dinoflagellate ingestion rate (IR; cell volume dinoflagellate−1 h−1) and biogenic silica content (fmol µm−3) (p > 0.05). (f) Relationship between dinoflagellate ingestion rate and prey size (size; µm). A log-normal distribution was fitted to the prey size spectrum: IR = 309.1 × exp[−0.5 × ((log(size) – 7.7)/2.9)2] (r2 = 0.55; p < 0.05); long-dashed lines are 95% confidence intervals. Details about experimental organisms are provided in table 1. HL, high light conditions; LL, low light conditions. (Online version in colour.)
Figure 3.
Figure 3.
(a) Relationship between fraction of viable cells in copepod faecal pellets (survivors; %) and biogenic silica content of ingested cells (fmol µm−3) (p > 0.05); and (b) between viable cells and size of diatoms (µm) (p > 0.05). Details about experimental organisms are provided in table 1. HL, high light conditions; LL, low light conditions. (Online version in colour.)
Figure 4.
Figure 4.
Steady-state silica content in diatoms as a function of cell division rate for diatoms that are limited by factors other than silica (nitrogen N, phosphorus P, light L or temperature T, as indicated in the legend). Data obtained from [32,35,37,56]. A fitted mixed linear model with one slope and random intercepts was fitted to the log–log relationships between silica content and growth rate. The estimated slope is −0.54 [−0.36, −0.72]. (Online version in colour.)

Similar articles

Cited by

References

    1. Mortensen B. 2013. Plant resistance against herbivory. Nat. Educ. Knowl. 4, 1–5.
    1. Pančić M, Kiørboe T. 2018. Phytoplankton defence mechanisms: traits and trade-offs. Biol. Rev. 93, 1269–1303. (10.1111/brv.12395) - DOI - PubMed
    1. Jakobsen HH, Tang KW. 2002. Effects of protozoan grazing on colony formation in Phaeocystis globosa (Prymnesiophyceae) and the potential costs and benefits. Aquat. Microb. Ecol. 27, 261–273. (10.3354/ame027261) - DOI
    1. Selander E, Thor P, Toth G, Pavia H. 2006. Copepods induce paralytic shellfish toxin production in marine dinoflagellates. Proc. R. Soc. B 273, 1673–1680. (10.1098/rspb.2006.3502) - DOI - PMC - PubMed
    1. Pondaven P, Gallinari M, Chollet S, Bucciarelli E, Sarthou G, Schultes S, Jean F. 2007. Grazing-induced changes in cell wall silicification in a marine diatom. Protist 158, 21–28. (10.1016/j.protis.2006.09.002) - DOI - PubMed

Publication types

Substances

LinkOut - more resources