

A network-based approach for identifying suitable biomarkers for oral immunotherapy of food allergy
- PMID: 31014233
- PMCID: PMC6480866
- DOI: 10.1186/s12859-019-2802-9
A network-based approach for identifying suitable biomarkers for oral immunotherapy of food allergy
Abstract
Background: Oral immunotherapy (OIT) is a promising therapeutic approach to treat food allergic patients. However, concerns with regards to safety and long-term efficacy of OIT remain. There is a need to identify biomarkers that predict, monitor and/or evaluate the effects of OIT. Here we present a method to select candidate biomarkers for efficacy and safety assessment of OIT using the computational approaches Bayesian networks (BN) and Topological Data Analysis (TDA).
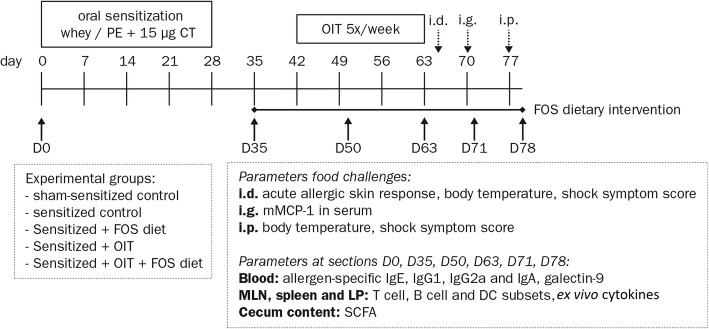
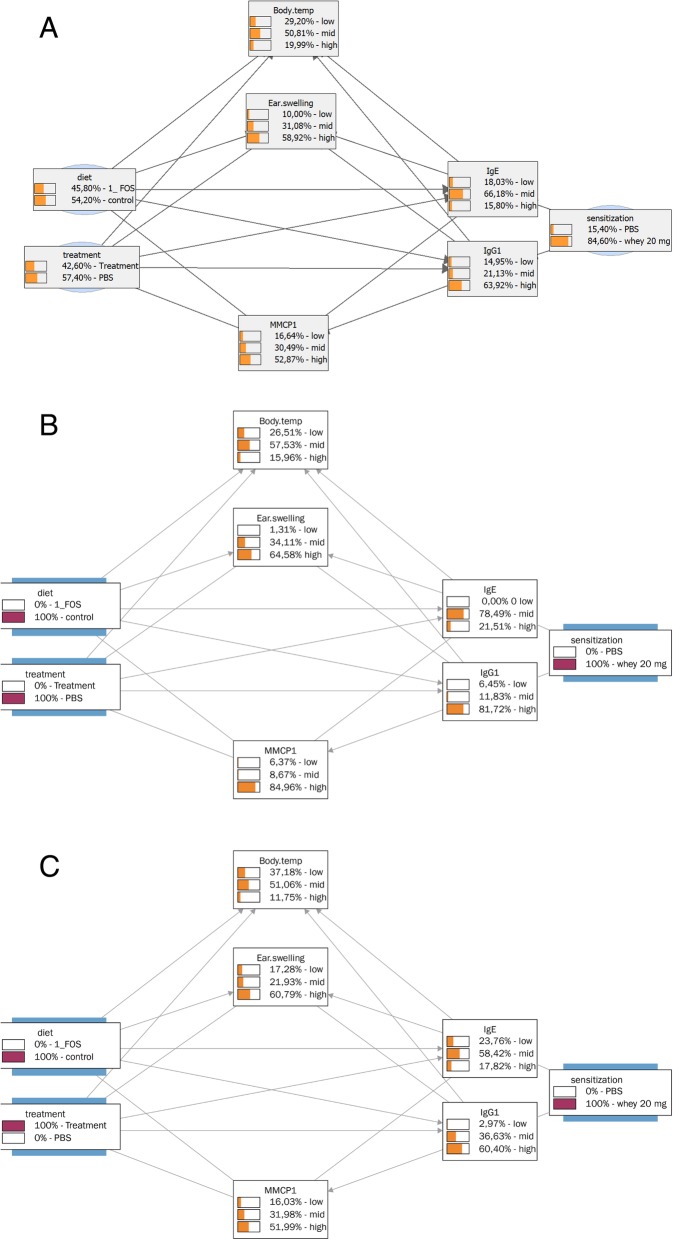
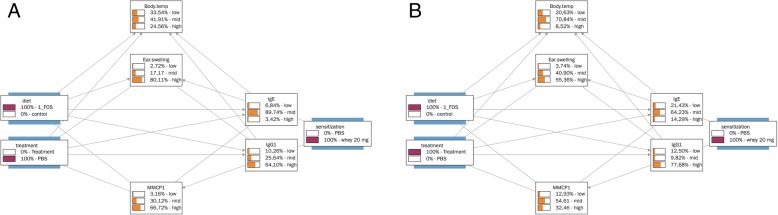
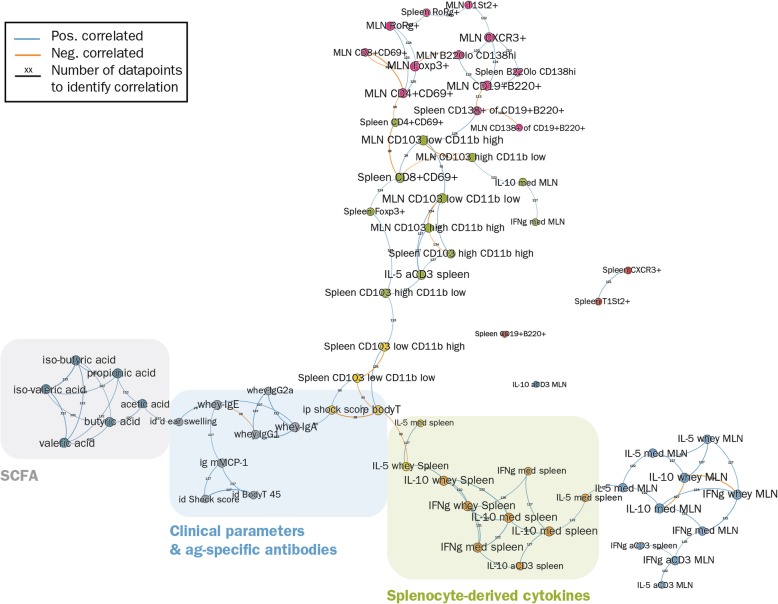
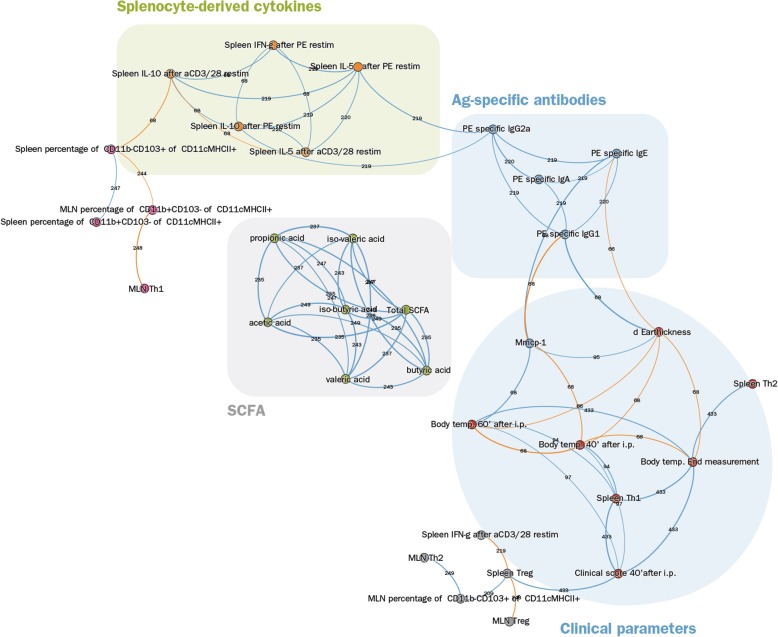
Results: Data were used from fructo-oligosaccharide diet-supported OIT experiments performed in 3 independent cow's milk allergy (CMA) and 2 independent peanut allergy (PNA) experiments in mice. Bioinformatical approaches were used to understand the data structure. The BN predicted the efficacy of OIT in the CMA with 86% and indicated a clear effect of scFOS/lcFOS on allergy parameters. For the PNA model, this BN (trained on CMA data) predicted an efficacy of OIT with 76% accuracy and shows similar effects of the allergen, treatment and diet as compared to the CMA model. The TDA identified clusters of biomarkers closely linked to biologically relevant clinical symptoms and also unrelated and redundant parameters within the network.
Conclusions: Here we provide a promising application of computational approaches to a) compare mechanistic features of two different food allergies during OIT b) determine the biological relevance of candidate biomarkers c) generate new hypotheses to explain why CMA has a different disease pattern than PNA and d) select relevant biomarkers for future studies.
Keywords: Bayesian network analyses; Bioinformatics; Experimental food allergy; Oral immunotherapy; Topological data analyses.
Conflict of interest statement
Ethics approval and consent to participate
The experimental procedures from these previously published murine studies were approved and conducted according to the guidelines determined by the Ethical Committee of Animal Research of Utrecht University (DEC2014.III.12.120 and AVD108002015212).
Consent for publication
Not applicable.
Competing interests
The authors declare that they have no competing interests.
Publisher’s Note
Springer Nature remains neutral with regard to jurisdictional claims in published maps and institutional affiliations.
Figures
Similar articles
-
The efficacy of oral and subcutaneous antigen-specific immunotherapy in murine cow's milk- and peanut allergy models.Clin Transl Allergy. 2017 Sep 29;7:35. doi: 10.1186/s13601-017-0170-y. eCollection 2017. Clin Transl Allergy. 2017. PMID: 29021893 Free PMC article.
-
Identification of novel peptide biomarkers to predict safety and efficacy of cow's milk oral immunotherapy by peptide microarray.Clin Exp Allergy. 2015 Jun;45(6):1071-84. doi: 10.1111/cea.12528. Clin Exp Allergy. 2015. PMID: 25772539
-
Dietary Supplementation with Nondigestible Oligosaccharides Reduces Allergic Symptoms and Supports Low Dose Oral Immunotherapy in a Peanut Allergy Mouse Model.Mol Nutr Food Res. 2018 Oct;62(20):e1800369. doi: 10.1002/mnfr.201800369. Epub 2018 Aug 31. Mol Nutr Food Res. 2018. PMID: 30102006 Free PMC article.
-
Oral and Sublingual Immunotherapy for Treatment of IgE-Mediated Food Allergy.Clin Rev Allergy Immunol. 2018 Oct;55(2):139-152. doi: 10.1007/s12016-018-8677-0. Clin Rev Allergy Immunol. 2018. PMID: 29656306 Review.
-
Oral Immunotherapy for Food Allergy.J Investig Allergol Clin Immunol. 2017;27(3):151-159. doi: 10.18176/jiaci.0143. Epub 2017 Jan 19. J Investig Allergol Clin Immunol. 2017. PMID: 28102823 Review.
Cited by
-
Biomarkers associated with persistence and severity of IgE-mediated food allergies: a systematic review.J Pediatr (Rio J). 2023 Jul-Aug;99(4):315-321. doi: 10.1016/j.jped.2023.02.004. Epub 2023 Mar 25. J Pediatr (Rio J). 2023. PMID: 36977497 Free PMC article. Review.
-
Immunological Outcomes of Allergen-Specific Immunotherapy in Food Allergy.Front Immunol. 2020 Nov 3;11:568598. doi: 10.3389/fimmu.2020.568598. eCollection 2020. Front Immunol. 2020. PMID: 33224138 Free PMC article. Review.
References
MeSH terms
Substances
Grants and funding
LinkOut - more resources
Full Text Sources
Medical
