. 2019 Apr 23;20(1):207.
doi: 10.1186/s12859-019-2747-z.

Estimates of introgression as a function of pairwise distances

Affiliations

Estimates of introgression as a function of pairwise distances

Bastian Pfeifer et al. BMC Bioinformatics. .

Abstract

Background: Research over the last 10 years highlights the increasing importance of hybridization between species as a major force structuring the evolution of genomes and potentially providing raw material for adaptation by natural and/or sexual selection. Fueled by research in a few model systems where phenotypic hybrids are easily identified, research into hybridization and introgression (the flow of genes between species) has exploded with the advent of whole-genome sequencing and emerging methods to detect the signature of hybridization at the whole-genome or chromosome level. Amongst these are a general class of methods that utilize patterns of single-nucleotide polymorphisms (SNPs) across a tree as markers of hybridization. These methods have been applied to a variety of genomic systems ranging from butterflies to Neanderthals to detect introgression, however, when employed at a fine genomic scale these methods do not perform well to quantify introgression in small sample windows.

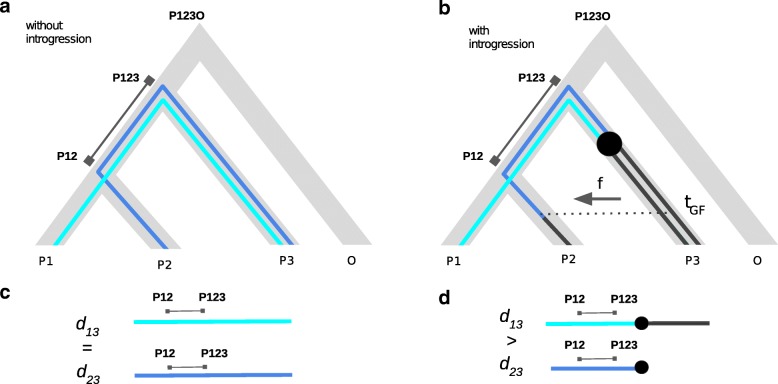
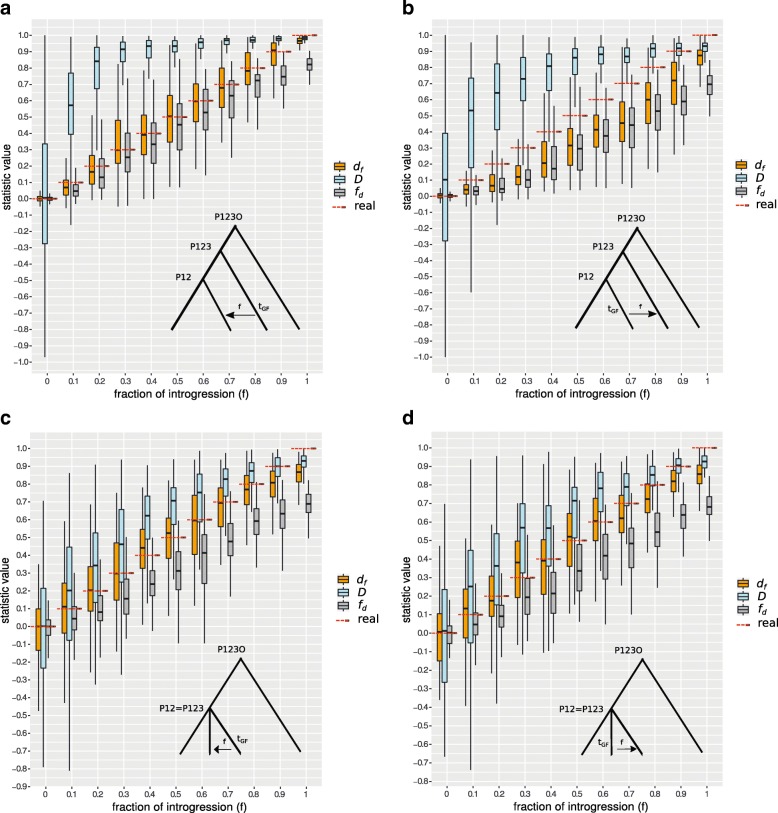
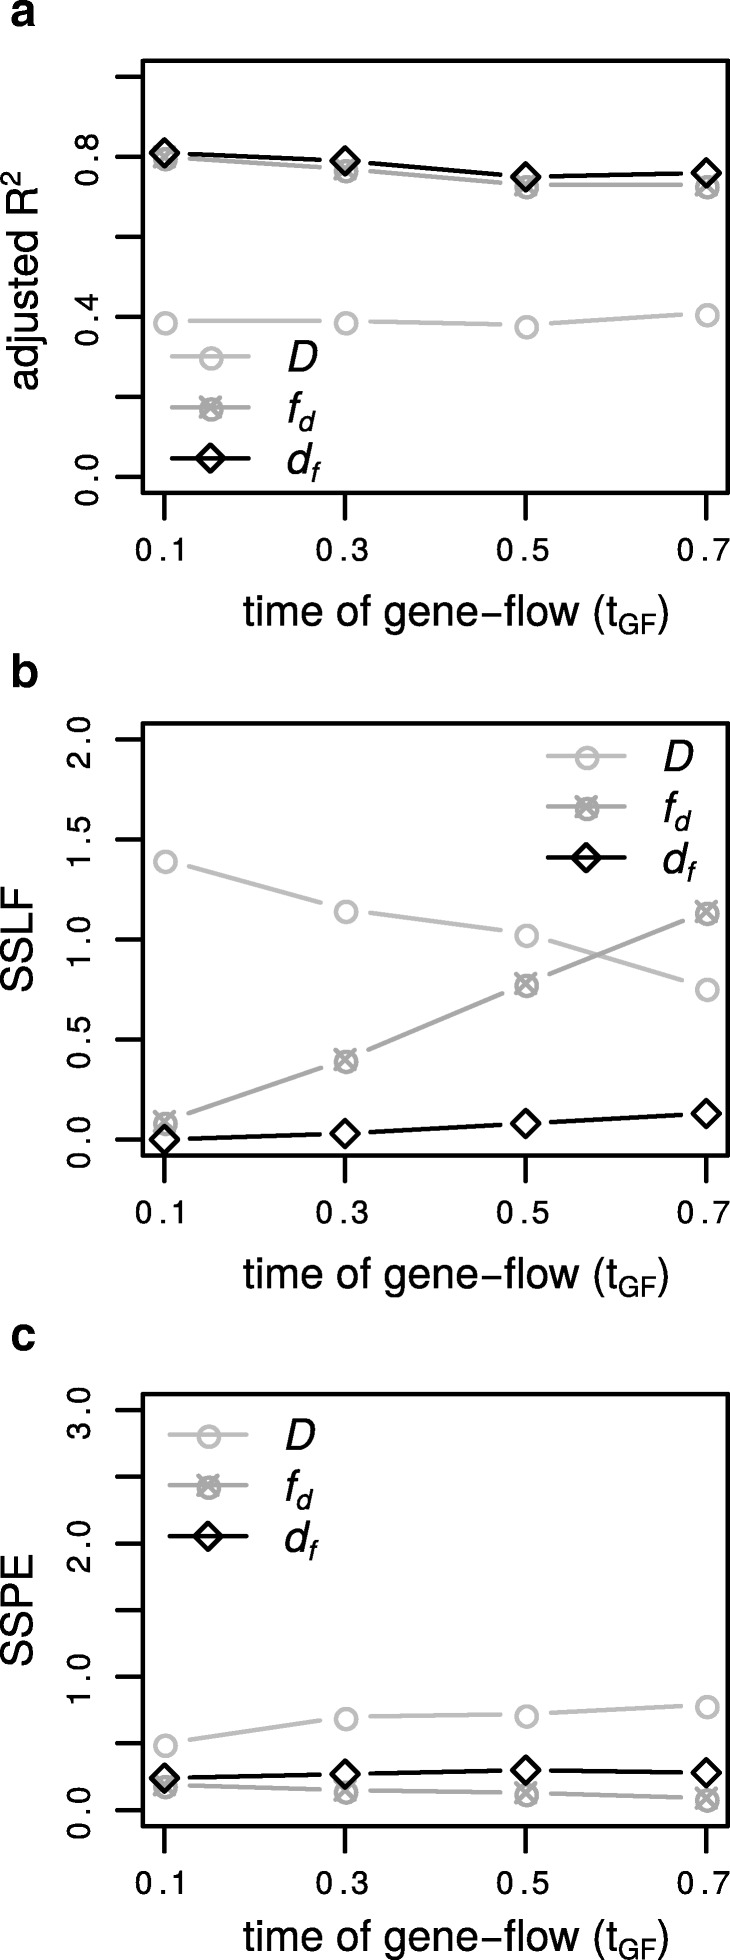
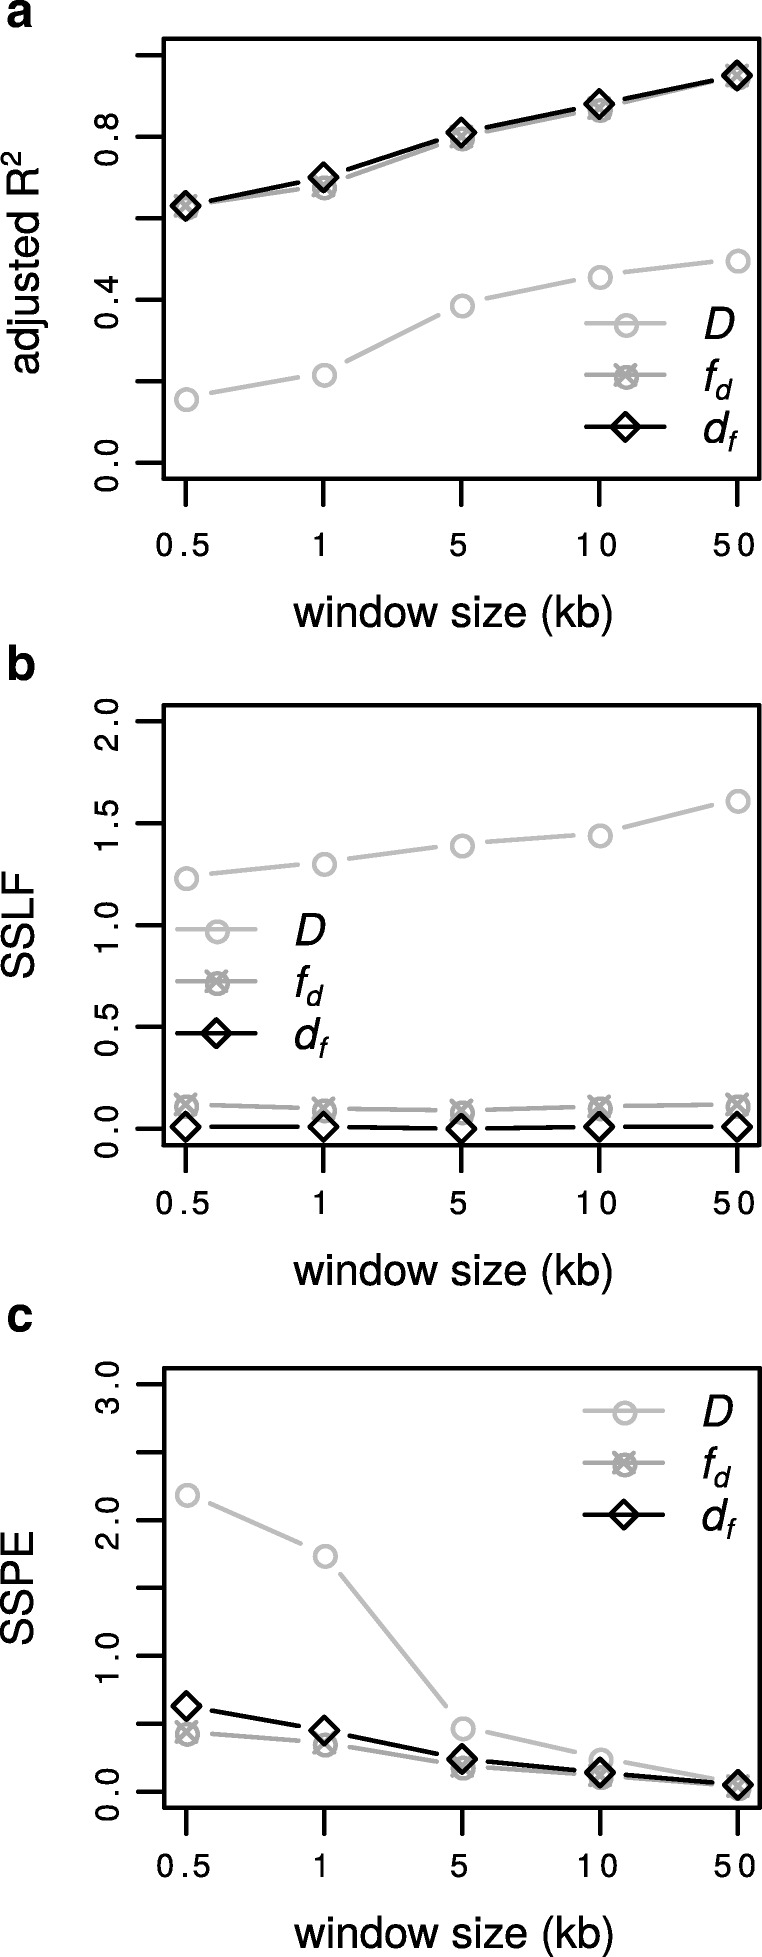
Results: We introduce a novel method to detect introgression by combining two widely used statistics: pairwise nucleotide diversity dxy and Patterson's D. The resulting statistic, the distance fraction (df), accounts for genetic distance across possible topologies and is designed to simultaneously detect and quantify introgression. We also relate our new method to the recently published fd and incorporate these statistics into the powerful genomics R-package PopGenome, freely available on GitHub (pievos101/PopGenome) and the Comprehensive R Archive Network (CRAN). The supplemental material contains a wide range of simulation studies and a detailed manual how to perform the statistics within the PopGenome framework.

Conclusion: We present a new distance based statistic df that avoids the pitfalls of Patterson's D when applied to small genomic regions and accurately quantifies the fraction of introgression (f) for a wide range of simulation scenarios.

Keywords: Genomics; Hybridisation; Introgression; SNPs.


Conflict of interest statement

Ethics approval and consent to participate

Not applicable.

Consent for publication

Not applicable.

Competing interests

The authors declare that they have no competing interests.

Publisher’s Note

Springer Nature remains neutral with regard to jurisdictional claims in published maps and institutional affiliations.

Figures

Fig. 1
Fig. 1
A graphical interpretation of the df estimate. The distance fraction (df) estimates the fraction of introgression (f) by relating the differences of the genetic distances between taxa, here hi-lit by path lengths between ingroup taxa (d13= light blue, d23= dark blue) to the overall sum of the path lengths to the archaic population P3 taking into account derived alleles resulting in a change of path length distance. a. The four-taxon (P1, P2, P3 and O) species tree (gray) with coalescence at nodes denoted as P12, P123 and P123O. Path length P12-P123 helps visualize the scale of relative distance between taxa and signifies the shared distance of P1 and P2 to P3. b. Illustrates introgression from P3 to P2, here marked by derived alleles arising in and replacing the P3 lineage after the split leading to P12 (black dot). c. Without introgression d13=d23 and resulting in df=0 (left a & c). d. Introgression of derived alleles reduces genetic distance between P2 and P3 at the time of gene-flow (tGF) causing d23<d13 and df to be positive (right b & d). Note, allele replacement in example (b, d) corresponds to SNP pattern ABBA. The df estimate relates the reduced distance caused by introgression to the total sum of path length distances after introgression. A mutation on the P12-P123 path corresponds to the SNP pattern BBAA and signifies shared distance
Fig. 2
Fig. 2
Accuracy of statistics to measure the fraction of introgression. The comparison of simulated data with a known fraction of introgression using ms versus the statistics (y-axis). We simulated 100 loci for every fraction of introgression f=[0,0.1,…0.9,1] and plotted the distribution of the corresponding statistic outcomes. A window size of 5kb and a recombination rate of r=0.01 was used. The background histories (coalescent events, see insets) are a P12= 1×4N, P123= 2×4N, P123O= 3×4N generations ago. b P12= 1×4N, P123= 2×4N, P123O= 3×4N generations ago. c P12= 1×4N, P123= 1×4N, P123O= 3×4N generations ago. d P12= 1×4N, P123= 1×4N, P123O= 3×4N generations ago. Introgression directions are P3→P2 (a,c) and P2→P3 (b,d) tGF=0.1×4N generations ago. Colors: fd (grey), df (orange) Patterson’s D (light blue) and the real fraction of introgression (red dashed lines). The calls to the ms program can be found in the caption of Additional file 1: Table S1.1
Fig. 3
Fig. 3
The effect of time of gene-flow. For P3→P2 introgression we varied the time of gene-flow (tGF=0.1, 0.3, 0.5, 0.7 ×4N) and calculated for each statistic (D, fd and df) a the adjusted R2 ’goodness of fit’. b SSLF ’sum of squares due to lack of fit’ divided by the sample size n=100. c SSPE ’pure sum of squares error’. A window size of 5kb and a recombination rate of r=0.01 was used. The background history is: P12= 1×4N, P123= 2×4N and P123O= 3×4N generations ago. The calls to the ms program can be found in the caption of Additional file 1: Table S1.3
Fig. 4
Fig. 4
The effect of window size. For P3→P2 introgression we varied window sizes (0.5, 1, 5, 10, 50 kb) and calculated for each statistic (D, fd and df) a the adjusted R2 ’goodness of fit’. b SSLF ’sum of squares due to lack of fit’ divided by the sample size n=100. c SSPE ’pure sum of squares error’. The recombination rate is r=0.01. The background history is: P12= 1×4N, P123= 2×4N and P123O= 3×4N generations ago. Time of gene-flow is set to tGF=0.1×4N generations ago. The calls to the ms program can be found in the caption of Additional file 1: Table S1.6
Fig. 5
Fig. 5
Anopheles gambiae 3La inversion. Confirming introgression on the 3L arm of the malaria vector Anopheles gambiae (Fontaine et al. 2015, Fig. 4). The area between the vertical dashed lines delineate the introgressed chromosomal inversion. We used the R-package PopGenome to scan the chromosome with 50kb consecutive windows and plotted the df values along the chromosome (Laplace smoothed). Orange boxes indicate outlier windows below a significance level of 0.05 and red boxes show outlier windows on the basis of a 0.01 significance level. The p-values were corrected for multiple testing by the Benjamini-Hochberg method
Fig. 6
Fig. 6
The effect of introgression on pairwise distances. The effect of the fraction of introgression on the average pairwise distance measurements d12, d13 and d23. a The effect is shown for P3→P2 introgression. b Shows the effect in case of P2→P3 introgression. The background history is: P12= 1×4N, P123= 2×4N and P123O= 3×4N generations ago. Time of gene-flow is set to tGF=0.1×4N generations ago. The calls to the ms program can be found in the example from the methods section

Similar articles

Cited by

References

    1. Mallett J. Hybridization reveals the evolving genomic architecture of speciation. Trends Ecol Evol. 2005;20:229–37. doi: 10.1016/j.tree.2005.02.010. - DOI - PubMed
    1. Gilbert LE. Adaptive novelty through introgression in Heliconius wing patterns: evidence for shared genetic “tool box” from synthetic hybrid zones and a theory of diversification. In: Boggs CL, Watt W, Ehrlich P, editors. Ecology and Evolution Taking Flight: Butterflies as Model Systems. Chicago: University of Chicago Press; 2003.
    1. Hedrick PW. Adaptive introgression in animals: examples and comparison to new mutation and standing variation as sources of adaptive variation. Mol Ecol. 2013;22:4606–18. doi: 10.1111/mec.12415. - DOI - PubMed
    1. Stelkens RB, et. al Hybridization facilitates evolutionary rescue. Evol Appl. 2014;7:1209. doi: 10.1111/eva.12214. - DOI - PMC - PubMed
    1. Pfennig KS, Kelly AL, Pierce AA. Hybridization as a facilitator of species range expansion. Proc R Soc Lond Ser B. 2016; 283. - PMC - PubMed

LinkOut - more resources