

Comprehensive characterization of T-DNA integration induced chromosomal rearrangement in a birch T-DNA mutant
- PMID: 31014254
- PMCID: PMC6480916
- DOI: 10.1186/s12864-019-5636-y
Comprehensive characterization of T-DNA integration induced chromosomal rearrangement in a birch T-DNA mutant
Abstract
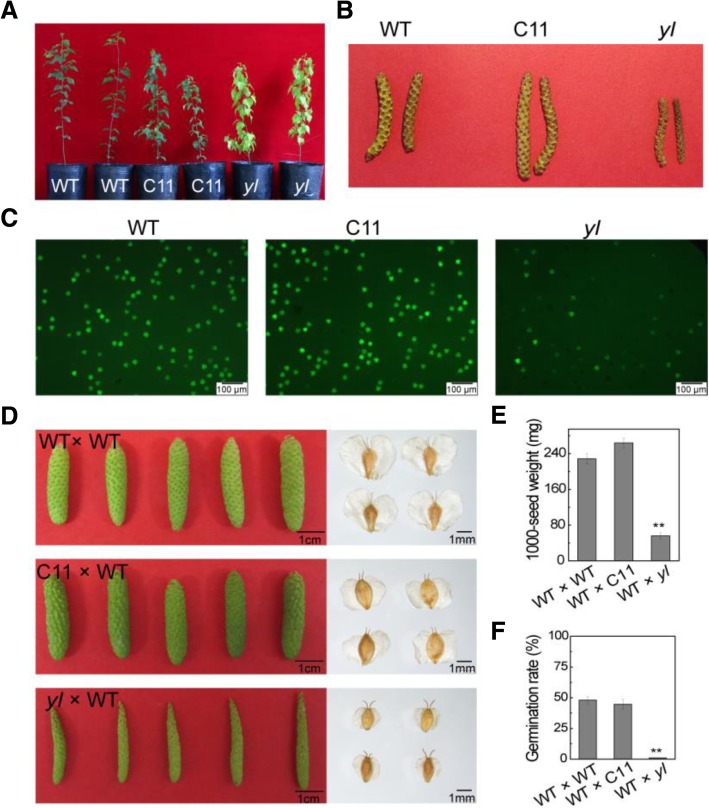
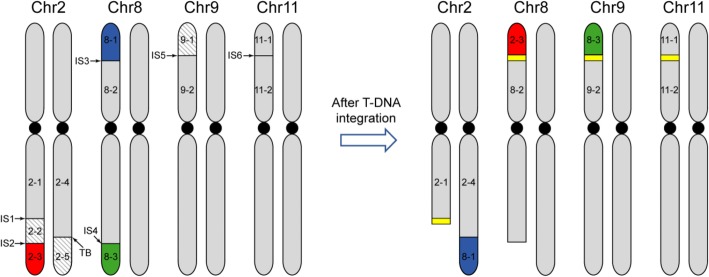
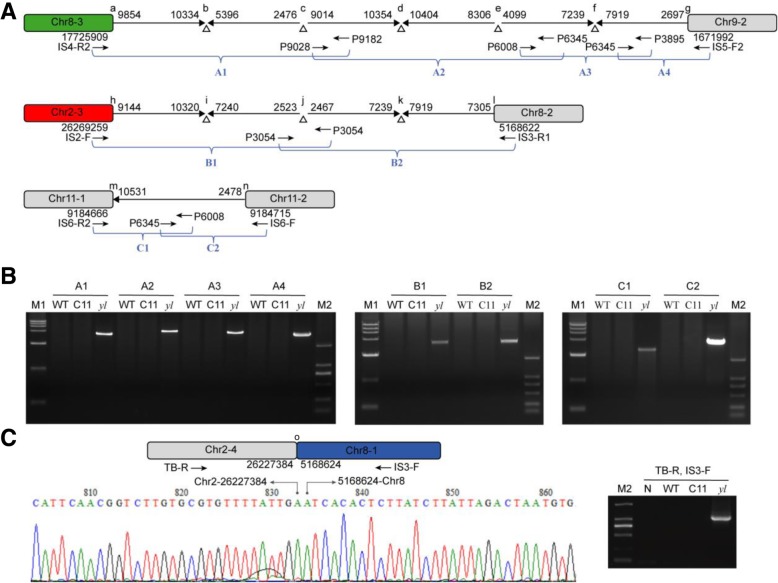
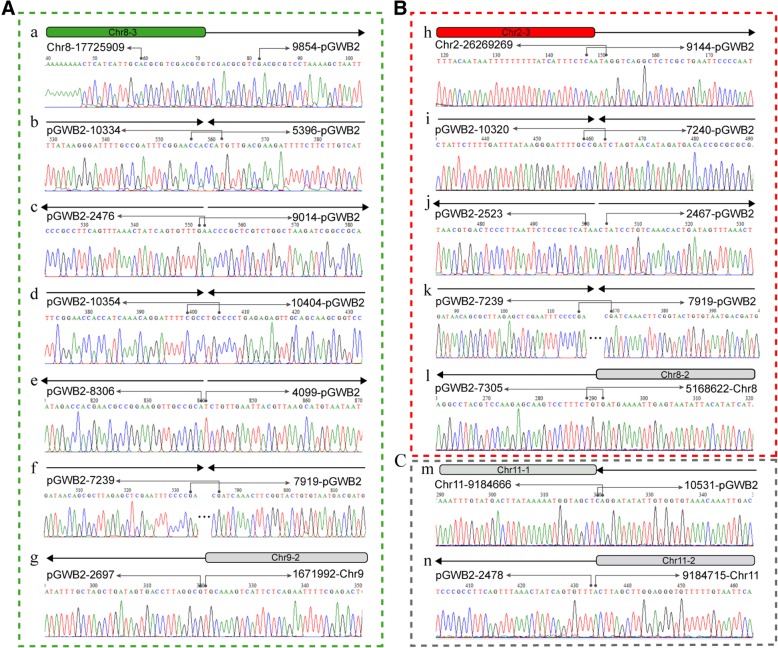
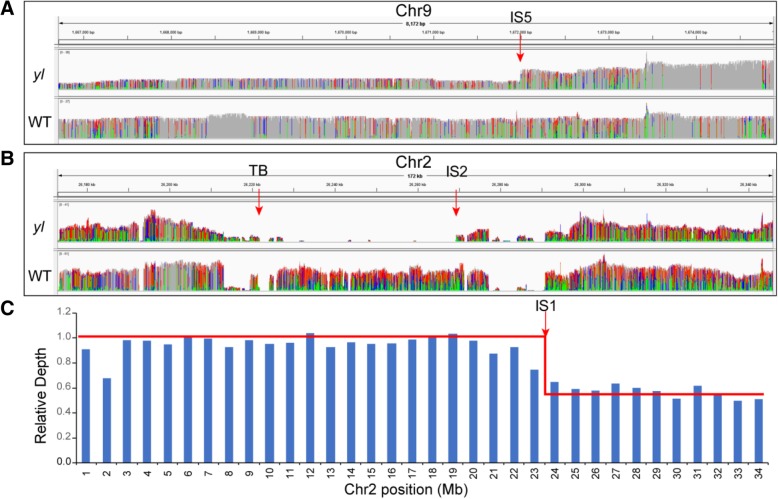
Background: Integration of T-DNA into plant genomes via Agrobacterium may interrupt gene structure and generate numerous mutants. The T-DNA caused mutants are valuable materials for understanding T-DNA integration model in plant research. T-DNA integration in plants is complex and still largely unknown. In this work, we reported that multiple T-DNA fragments caused chromosomal translocation and deletion in a birch (Betula platyphylla × B. pendula) T-DNA mutant yl.
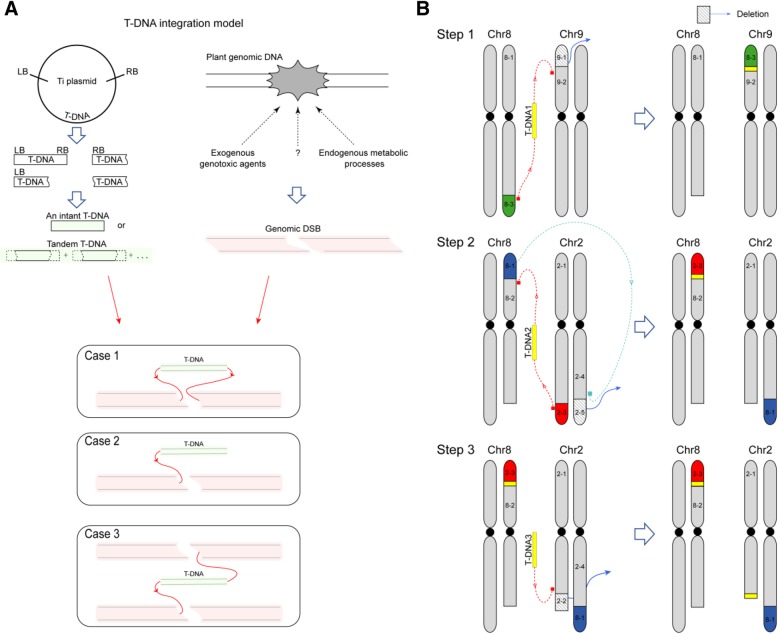
Results: We performed PacBio genome resequencing for yl and the result revealed that two ends of a T-DNA can be integrated into plant genome independently because the two ends can be linked to different chromosomes and cause chromosomal translocation. We also found that these T-DNA were connected into tandem fragment regardless of direction before integrating into plant genome. In addition, the integration of T-DNA in yl genome also caused several chromosomal fragments deletion. We then summarized three cases for T-DNA integration model in the yl genome. (1) A T-DNA fragment is linked to the two ends of a double-stranded break (DSB); (2) Only one end of a T-DNA fragment is linked to a DSB; (3) A T-DNA fragment is linked to the ends of different DSBs. All the observations in the yl genome supported the DSB repair model.
Conclusions: In this study, we showed a comprehensive genome analysis of a T-DNA mutant and provide a new insight into T-DNA integration in plants. These findings would be helpful for the analysis of T-DNA mutants with special phenotypes.
Keywords: Birch; Chromosomal rearrangement; Multiple T-DNA; T-DNA integration; T-DNA mutant.
Conflict of interest statement
Ethics approval and consent to participate
Not applicable.
Consent for publication
Not applicable.
Competing interests
The authors declare that they have no competing interests.
Publisher’s Note
Springer Nature remains neutral with regard to jurisdictional claims in published maps and institutional affiliations.
Figures
Similar articles
-
Cascade of chromosomal rearrangements caused by a heterogeneous T-DNA integration supports the double-stranded break repair model for T-DNA integration.Plant J. 2017 Jun;90(5):954-965. doi: 10.1111/tpj.13523. Epub 2017 Apr 6. Plant J. 2017. PMID: 28244154
-
Characterization and T-DNA insertion sites identification of a multiple-branches mutant br in Betula platyphylla × Betula pendula.BMC Plant Biol. 2019 Nov 12;19(1):491. doi: 10.1186/s12870-019-2098-y. BMC Plant Biol. 2019. PMID: 31718548 Free PMC article.
-
Effects of Arabidopsis Ku80 deletion on the integration of the left border of T-DNA into plant chromosomal DNA via Agrobacterium tumefaciens.Genes Genet Syst. 2020 Oct 23;95(4):173-182. doi: 10.1266/ggs.19-00064. Epub 2020 Aug 26. Genes Genet Syst. 2020. PMID: 32848122
-
Plant DNA Repair and Agrobacterium T-DNA Integration.Int J Mol Sci. 2021 Aug 6;22(16):8458. doi: 10.3390/ijms22168458. Int J Mol Sci. 2021. PMID: 34445162 Free PMC article. Review.
-
Repairing breaks in the plant genome: the importance of keeping it together.New Phytol. 2011 Dec;192(4):805-822. doi: 10.1111/j.1469-8137.2011.03926.x. Epub 2011 Oct 11. New Phytol. 2011. PMID: 21988671 Review.
Cited by
-
Microbiome and plant cell transformation trigger insect gall induction in cassava.Front Plant Sci. 2023 Nov 29;14:1237966. doi: 10.3389/fpls.2023.1237966. eCollection 2023. Front Plant Sci. 2023. PMID: 38126017 Free PMC article.
-
Beyond a few bases: methods for large DNA insertion and gene targeting in plants.Plant J. 2025 Mar;121(6):e70099. doi: 10.1111/tpj.70099. Plant J. 2025. PMID: 40121601 Free PMC article. Review.
-
CRISPR/Cas9-Mediated Targeted DNA Integration: Rearrangements at the Junction of Plant and Plasmid DNA.Int J Mol Sci. 2022 Aug 3;23(15):8636. doi: 10.3390/ijms23158636. Int J Mol Sci. 2022. PMID: 35955778 Free PMC article.
-
Genomic consequences associated with Agrobacterium-mediated transformation of plants.Plant J. 2024 Jan;117(2):342-363. doi: 10.1111/tpj.16496. Epub 2023 Oct 13. Plant J. 2024. PMID: 37831618 Free PMC article. Review.
-
Gene targeting in polymerase theta-deficient Arabidopsis thaliana.Plant J. 2022 Jan;109(1):112-125. doi: 10.1111/tpj.15557. Epub 2021 Nov 18. Plant J. 2022. PMID: 34713516 Free PMC article.
References
-
- Zhang J, Guo D, Chang YX, You CJ, Li XW, Dai XX, et al. Non-random distribution of T-DNA insertions at various levels of the genome hierarchy as revealed by analyzing 13 804 T-DNA flanking sequences from an enhancer-trap mutant library. Plant J. 2007;49(5):947–959. doi: 10.1111/j.1365-313X.2006.03001.x. - DOI - PubMed
MeSH terms
Substances
Grants and funding
LinkOut - more resources
Full Text Sources
