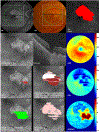
Distribution of OCT Features within Areas of Macular Atrophy or Scar after 2 Years of Anti-VEGF Treatment for Neovascular AMD in CATT
- PMID: 31014683
- PMCID: PMC6482846
- DOI: 10.1016/j.oret.2018.11.011
Distribution of OCT Features within Areas of Macular Atrophy or Scar after 2 Years of Anti-VEGF Treatment for Neovascular AMD in CATT
Abstract
Purpose: Macular atrophy and scar increase in prevalence during treatment for neovascular age-related macular degeneration and are associated with poor visual acuity. We sought to identify the distribution of spectral-domain OCT (SD-OCT)-determined features and subretinal lesion thicknesses at sites of macular scar or atrophy after 2 years of treatment in the Comparison of Age-Related Macular Degeneration Treatments Trials (CATT).
Design: Cross-sectional analysis.
Participants: CATT participants with SD-OCT, color photographic (CP) and fluorescein angiogram (FA; CP/FA) images at year 2.
Methods: Sixty-eight study eyes at year 2 in CATT were selected based on image quality and CP/FA-determined predominant presence of the following: geographic atrophy (GA, n = 25), non-GA (NGA, n = 44), fibrotic scar (FS, n = 26), or non-FS (NFS, n = 7). The CP/FA components were delineated by CP/FA readers; SD-OCT morphologic features and thicknesses were delineated by OCT readers. Using custom software and graphic user interfaces, images were registered, overlaying features and components per pixel; differences were analyzed across groups.
Main outcome measures: OCT features, CP/FA components, and retinal and subretinal lesion thicknesses at each pixel of regional overlays.
Results: SD-OCT assessment of registered areas of pathology revealed the following: (1) retinal pigment epithelium atrophy (with or without residual lesion material) covered 75% of pixels designated as GA, 22% of NGA, 24% of NFS, and 46% of FS (P < 0.001). (2) Photoreceptor layer thinning covered 85% of GA, 42% of NGA, 33% of NFS, and 59% of FS (P < 0.001). (3) Subretinal lesion features covered 31% of GA, 42% of NGA, 85% of NFS, and 92% of FS (P < 0.001). Mean thickness of the subretinal lesion complex (measured in microns ± standard deviation) differed among GA (48±25 μm), NGA (61±35 μm), NFS (83±17 μm), and FS (151±74 μm) (P < 0.001). In eyes with GA, the thickness was greater in areas with residual lesion (51.4±27 μm) than in those without (27.2±9 μm).
Conclusions: Retinal pigment epithelium atrophy and photoreceptor layer thinning are common not only in areas of macular atrophy but also in areas of FS. Photoreceptor loss extends beyond the areas of clinically apparent atrophy and FS. Subretinal lesion components were common in areas of scar, but they were also present in nearly one-third or more of areas of macular atrophy.
Trial registration: ClinicalTrials.gov NCT00593450.
Copyright © 2018 American Academy of Ophthalmology. Published by Elsevier Inc. All rights reserved.
Figures


References
-
- Sadda SR, Tuomi LL, Ding B, et al. Macular Atrophy in the HARBOR Study for Neovascular Age-Related Macular Degeneration. Ophthalmology 2018. - PubMed
-
- Abdelfattah NS, Al-Sheikh M, Pitetta S, et al. Macular Atrophy in Neovascular Age-Related Macular Degeneration with Monthly versus Treat-and-Extend Ranibizumab: Findings from the TREX-AMD Trial. Ophthalmology 2017;124(2):215–23. - PubMed
Publication types
MeSH terms
Substances
Associated data
Grants and funding
LinkOut - more resources
Full Text Sources
Medical
Miscellaneous

