. 2019 Jul:25:142-153.
doi: 10.1016/j.molmet.2019.04.005. Epub 2019 Apr 12.

Gsα deficiency in the dorsomedial hypothalamus leads to obesity, hyperphagia, and reduced thermogenesis associated with impaired leptin signaling

Affiliations

Gsα deficiency in the dorsomedial hypothalamus leads to obesity, hyperphagia, and reduced thermogenesis associated with impaired leptin signaling

Min Chen et al. Mol Metab. 2019 Jul.

Abstract

Objective: Gsα couples multiple receptors, including the melanocortin 4 receptor (MC4R), to intracellular cAMP generation. Germline inactivating Gsα mutations lead to obesity in humans and mice. Mice with brain-specific Gsα deficiency also develop obesity with reduced energy expenditure and locomotor activity, and impaired adaptive thermogenesis, but the underlying mechanisms remain unclear.

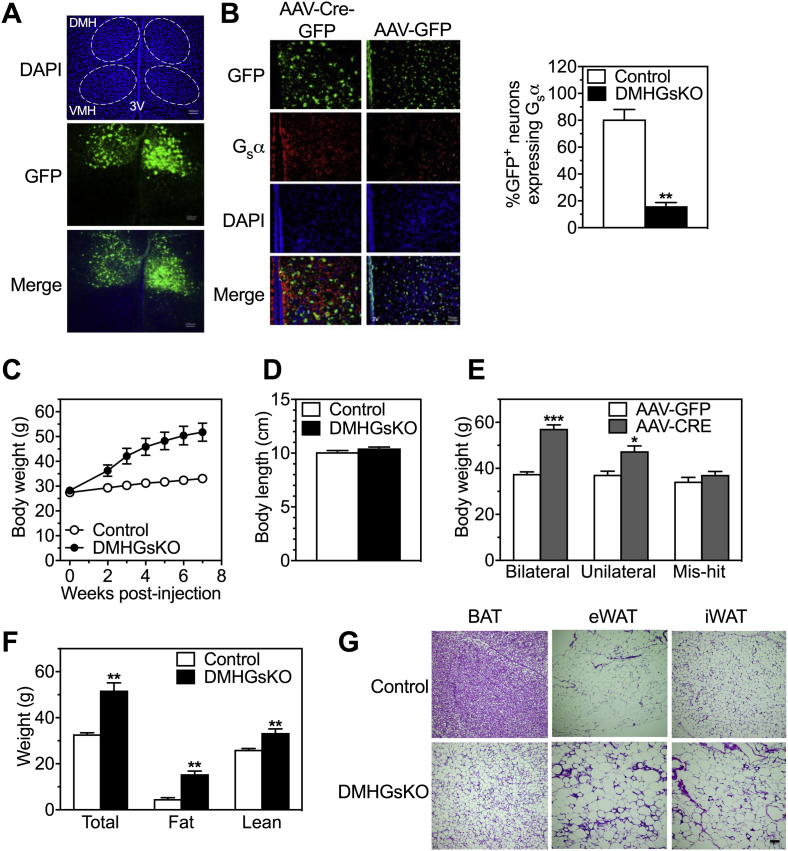
Methods: We created mice (DMHGsKO) with Gsα deficiency limited to the dorsomedial hypothalamus (DMH) and examined the effects on energy balance and thermogenesis.

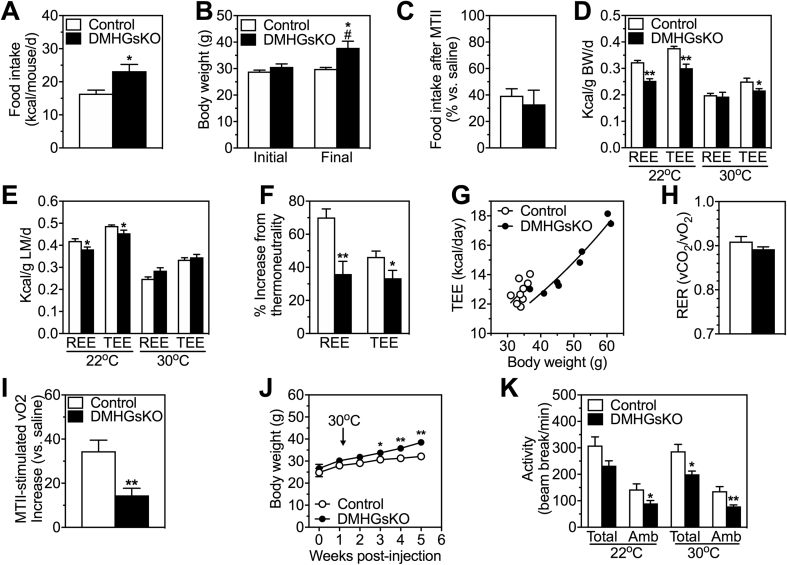
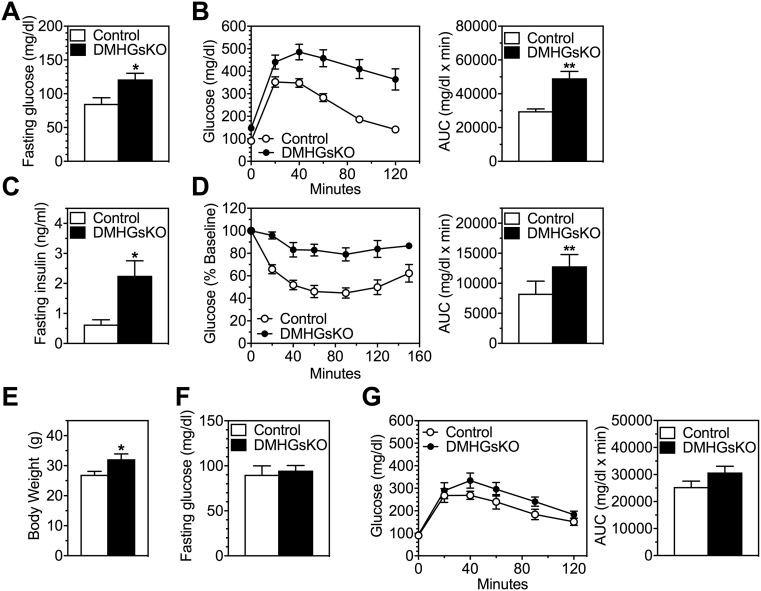
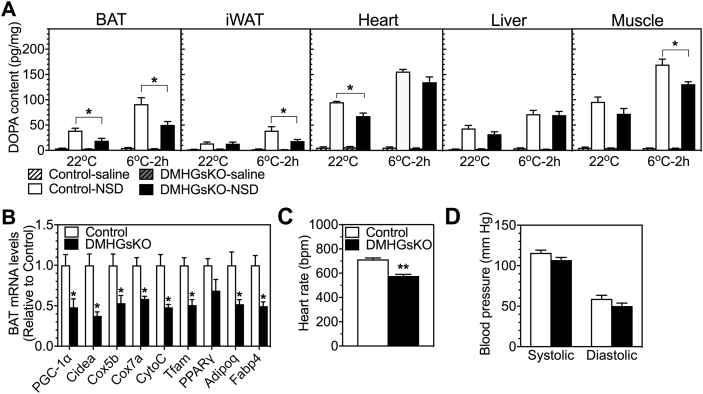
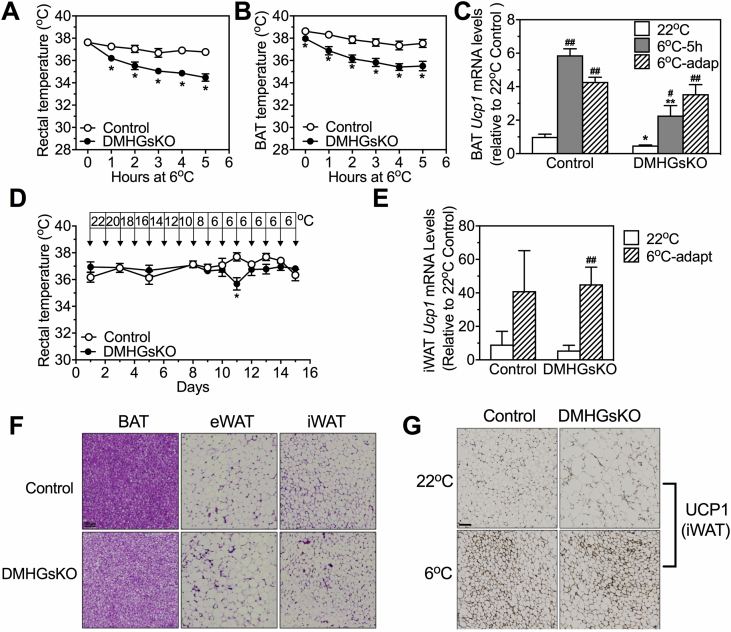
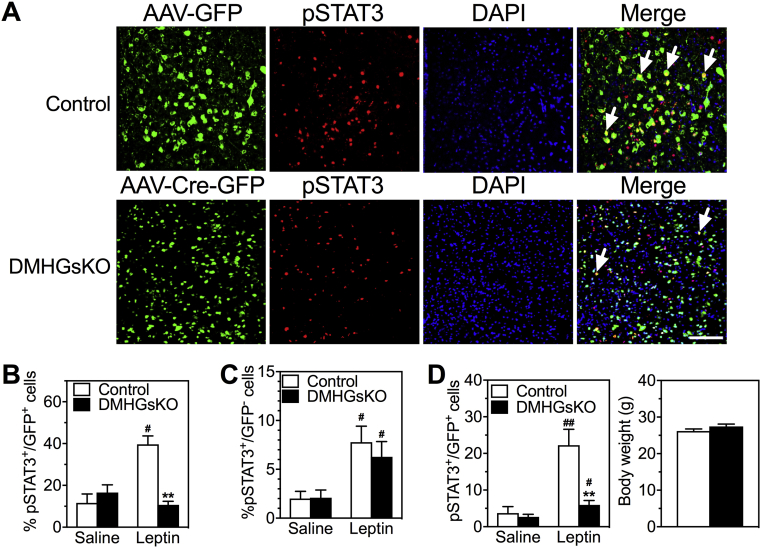
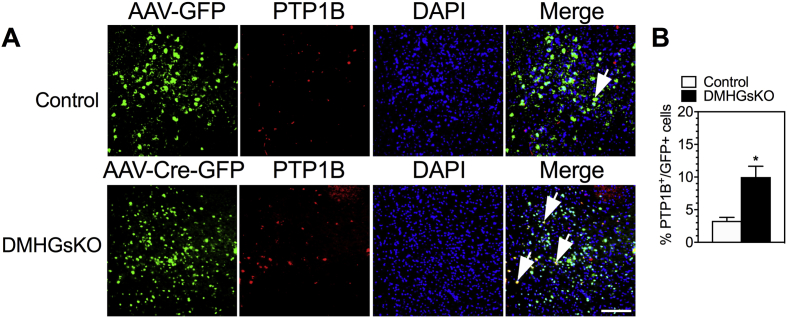
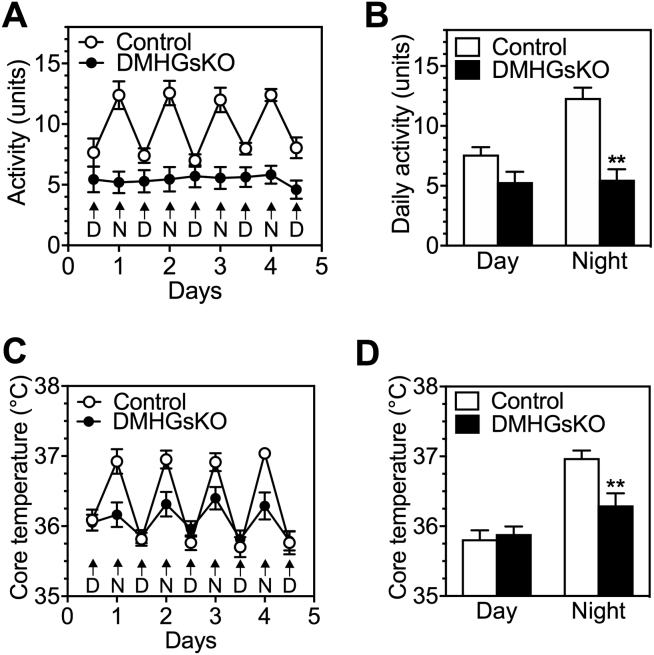
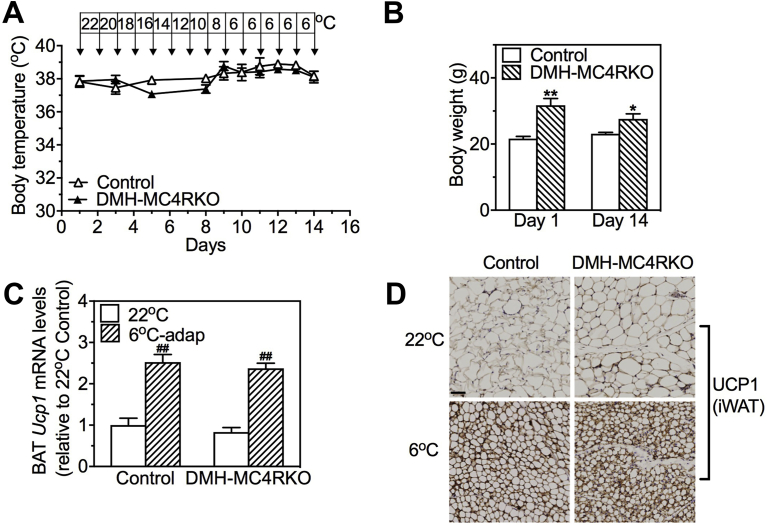
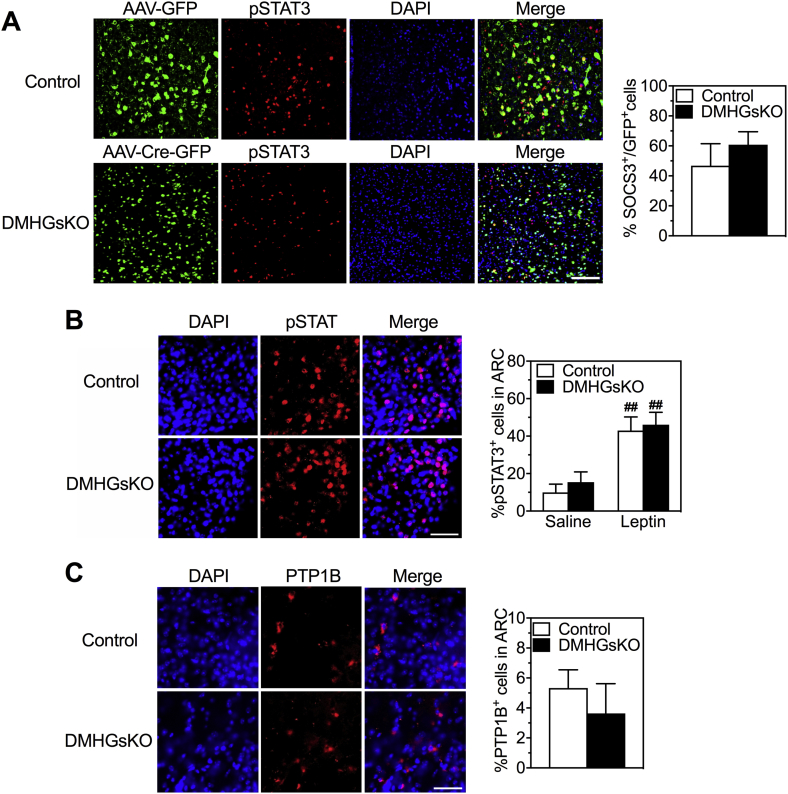
Results: DMHGsKO mice developed severe, early-onset obesity associated with hyperphagia and reduced energy expenditure and locomotor activity, along with impaired brown adipose tissue thermogenesis. Studies in mice with loss of MC4R in the DMH suggest that defective DMH MC4R/Gsα signaling contributes to abnormal energy balance but not to abnormal locomotor activity or cold-induced thermogenesis. Instead, DMHGsKO mice had impaired leptin signaling along with increased expression of the leptin signaling inhibitor protein tyrosine phosphatase 1B in the DMH, which likely contributes to the observed hyperphagia and reductions in energy expenditure, locomotor activity, and cold-induced thermogenesis.

Conclusions: DMH Gsα signaling is critical for energy balance, thermogenesis, and leptin signaling. This study provides insight into how distinct signaling pathways can interact to regulate energy homeostasis and temperature regulation.

Keywords: G protein; Hypothalamus; Obesity; Sympathetic nervous system; Thermogenesis.


Figures

Figure 1
Figure 1
DMHGsKO mice develop obesity. (A) Representative green fluorescence images confirming bilateral injection of AAV-Cre-GFP into the DMH. VMH, ventromedial hypothalamus; 3 V, third ventricle; DAPI, 4′,6-diamidino-2-phenylindole, dihydrochloride (scale bar, 100 μm). (B) Representative images of coimmunofluorescence staining with GFP (green, top) and Gsα protein (red, second row) in the DMH of control and DMHGsKO mice (scale bar, 50 μm). To the right is percent of GFP-expressing cells that are Gsα+, n = 3/group. (C) Body weight curves of male DMHGsKO and control mice post-viral injection, n = 10–11/group. (D) Body length of DMHGsKO and control mice, n = 5–7/group. (E) Body weight of mice at 3–4 months post-viral injection in which AAV-Cre-GFP was correctly targeted to the DMH bilaterally (n = 24–28/group), unilaterally (n = 9–11/group), or neither (mis-hit, n = 6/group). (F) Body composition (total, fat and lean weight) of DMHGsKO and control mice at 15–20 weeks post-injection, n = 10–11/group. (G) Histology (H&E staining) of BAT, epididymal WAT (eWAT) and inguinal WAT (iWAT) adipocytes from DMHGsKO mice and controls (scale bars, 100 μm). *p < 0.05, **p < 0.01, ***p < 0.001 vs. controls. Data represent mean ± S.E.M.
Figure 2
Figure 2
DMHGsKO mice have increased food intake and reduced energy expenditure and physical activity. (A) Mean daily food intake per mouse in DMHGsKO and control mice measured over 10 days starting at 7–11 days post-viral injection, n = 7–8/group. (B) Initial and final mean body weights of mice during the period of food intake measurement in panel A. (C) Total food intake after MTII in DMHGsKO and control mice expressed as % vs. after saline, n = 5–8/group. (D) Energy expenditure (total, TEE, and at rest, REE) measured at 22 °C and 30 °C (thermoneutrality) in DMHGsKO and control mice at 2.5–3 months post-viral injection and normalized by body weight, n = 9/group. Prior to study all mice were maintained at room temperature. (E) Data from experiments in panel D normalized to lean mass. (F) Percent increase in REE and TEE in control and DMHGsKO mice at 22 °C as compared to 30 °C taken from data presented in panels D and E. (G) Plot of daily TEE vs. body weight in individual DMHGsKO and control mice measured at 22 °C with lines indicating exponential fit. (H) Respiratory exchange ratio (vCO2/vO2; RER) measured over 24 h at 22 °C, n = 9/group. (I) Percent increase in energy expenditure (O2 consumption) in response to MTII in DMHGsKO and control mice, n = 9/group. (J) Body weight curves of DMHGsKO and control mice maintained at 30 °C for 4 weeks, n = 10–11/group. (I) Total and ambulatory (Amb) locomotor activity determined by infrared beam interruption, n = 9/group. *p < 0.05, **p < 0.01 vs. controls. #p < 0.05 vs. initial body weight. Data represent mean ± S.E.M.
Figure 3
Figure 3
Abnormal glucose metabolism in DMHGsKO mice. (A–D) Glucose metabolism in older mice after development of obesity. (A) Fasting glucose, n = 4–5/group, (B) glucose tolerance tests, n = 9–11/group, (C) fasting insulin levels, n = 4–5/group and (D) insulin tolerance tests in DMHGsKO and control mice at 3–4 months post-viral injection, n = 9/group. For glucose and insulin tolerance tests areas under the curve (AUC) are shown on the right. (E–G) Glucose metabolism at younger age prior to development of severe obesity. (E) Body weight, (F) fasting blood glucose, and (G) glucose tolerance test in mice at 2–3 weeks post-viral injection, n = 6–8/group. *p < 0.05, **p < 0.01 vs. controls. Data represent mean ± S.E.M.
Figure 4
Figure 4
Basal and cold-stimulated SNS activity in adult DMHGsKO mice. (A) Tissue DOPA content in BAT, iWAT, heart, liver and quadriceps muscle of control and DMHGsKO mice injected with either vehicle (saline) or NSD1015 (NSD) when they were kept at room temperature (22 °C) or exposed to cold (6 °C) for 2 h, n = 5–7/group. (B) Relative BAT mRNA levels in DMHGsKO and control mice, n = 6–8/group. (C–D) Cardiovascular function. (C) Heart rate and (D) systolic and diastolic blood pressure in DMHGsKO and control mice, n = 8/group. *p < 0.05, **p < 0.01 vs. controls. Data represent mean ± S.E.M.
Figure 5
Figure 5
Cold tolerance and adaptation experiments in DMHGsKO mice. (A–C) Acute cold tolerance experiments. (A) Rectal temperature, n = 11–13/group, and (B) BAT temperature, n = 8–9/group, measured during 5 h of cold exposure (6 °C). (C) Relative BAT Ucp1 mRNA levels in control and DMHGsKO mice that were maintained at 22 °C, exposed to 6 °C for 5 h or that underwent chronic cold adaptation (6oC-adapt), n = 4–7/group. (D–G) Chronic cold-adaptation experiments. (D) Rectal temperature in control and DMHGsKO mice during chronic cold adaptation, n = 6/group. (E) Relative iWAT Ucp1 mRNA levels in control and DMHGsKO mice at 22 °C or after chronic cold adaptation to 6 °C, n = 3–6/group. (F) Representative histologic images (H&E staining) of BAT, eWAT and iWAT from a DMHGsKO and control mouse after chronic cold adaptation (scale bar, 100 μm). (G) Representative images of immunohistochemical staining for UCP1 in iWAT from a DMHGsKO and control mice maintained at 22 °C or after chronic cold adaptation (scale bar, 100 μm). *p < 0.05, **p < 0.01 vs. controls. #p < 0.05, ##p < 0.01 vs. 22 °C. Data represent mean ± S.E.M.
Figure 6
Figure 6
Reduced leptin signaling in the DMH of DMHGsKO mice. (A) Representative images of immunofluorescence for AAV-GFP or AAV-Cre-GFP (green), pSTAT3 (red), DAPI (blue) and merged images after leptin administration in the DMH of DMHGsKO and control mice. Several pSTAT+/GFP+ cells are indicated with white arrows. (B) Quantification of % GFP+ cells that were also pSTAT3+ after injection of saline or leptin ip. into control or DMGsKO mice at 3–4 month post-viral injection, n = 4–8/group. (C) Quantification of % GFP cells that were also pSTAT3+ after injection of saline or leptin ip., n = 5–6/group. (D) Quantification of % GFP+ cells that were also pSTAT3+ after injection of saline or leptin ip. into control or DMGsKO mice at 2 weeks post-viral injection while the two groups had similar body weight (body weight shown to the right; n = 6/group). Scale bars, 100 μm. **p < 0.01 vs. controls. #p < 0.05, ##p < 0.01 vs. saline. Data represent mean ± S.E.M.
Figure 7
Figure 7
Increased PTP1B expression in DMH of DMHGsKO mice. (A) Representative images of PTP1B expression by immunofluorescence in DMH of 3–4 month-old control and DMHGsKO mice with several PTP1B+/GFP+ cells indicated with arrows. (B) Quantification of % GFP+ cells that were also PTP1B+ in control and DMHGsKO mice, n = 5–7/group. Scale bar, 100 μm. *p < 0.05 vs. controls. Data represent mean ± S.E.M.
Figure S1
Figure S1
Diurnal variations in activity and core temperature. (A) Daily activity of DMHGsKO and control mice measured by E-Mitter during the daylight (light, D) and night time (dark, N) periods examined over 5 days, n = 6 = 7/group. (B) Quantification of daylight and nighttime activity levels in panel A. (C) Core body temperature of DMHGsKO and control mice during daylight and nighttime measured by E-Mitter, n = 8/group. (D) Quantification of data shown in panel B. **p < 0.01 vs. controls. Data represent mean ± S.E.M.
Figure S2
Figure S2
DMH-MC4RKO mice adapt normally to chronic cold conditions. (A) Body temperature of control and DMH-MC4RKO mice during chronic cold adaptation experiment measured daily by rectal probe, n = 4/group. (B) Body weight of DMH-MC4RKO and control mice at the beginning (day 1) and the end (day 14) of the cold adaptation experiment, n = 4/group. (C) BAT Ucp1 mRNA levels in control and DMHGsKO mice at 22 °C or after cold adaptation to 6 °C, n = 4–7/group. (D) Representative iWAT sections from DMH-MC4RKO and control mice showing UCP1 expression by immunohistochemistry in mice maintained at 22 °C or after chronic cold adaptation (6 °C). Scale bars, 100 μm *p < 0.05, **p < 0.01 vs. controls. ##p < 0.01 vs. 22 °C. Data represent mean ± S.E.M.
Figure S3
Figure S3
SOCS3 expression in DMH and leptin signaling in the arcuate nucleus of hypothalamus (ARC) of control and DMHGsKO mice. (A) Representative images of SOC3 expression by immunofluorescence with quantification of SOCS3 expression in GFP-expressing cells on the right, n = 3/group. (B) Representative images of pSTAT3 immunofluorescence after leptin administration in the ARC of DMHGsKO and control mice. Quantification of percent of pSTAT3+ after administration of leptin or saline are shown on the right, n = 4–8/group. (C) Representative images of PTP1B immunofluorescence in the ARC of DMHGsKO and control mice. Quantification of PTP1B levels in the ARC of DMHGsKO and control mice is shown to the right, n = 4/group. Scale bars, 100 μm ##p < 0.01 vs. saline. Data represent mean ± S.E.M.

Similar articles

Cited by

References

    1. Huszar D., Lynch C.A., Fairchild-Huntress V., Dunmore J.H., Fang Q., Berkemeier L.R. Targeted disruption of the melanocortin-4 receptor results in obesity in mice. Cell. 1997;88:131–141. - PubMed
    1. Farooqi I.S., Keogh J.M., Yeo G.S., Lank E.J., Cheetham T., O'Rahilly S. Clinical spectrum of obesity and mutations in the melanocortin 4 receptor gene. New England Journal of Medicine. 2003;348:1085–1095. - PubMed
    1. Fan W., Morrison S.F., Cao W.H., Yu P. Thermogenesis activated by central melanocortin signaling is dependent on neurons in the rostral raphe pallidus (rRpa) area. Brain Research. 2007;1179:61–619. - PubMed
    1. Butler A.A., Cone R.D. The melanocortin receptors: lessons from knockout models. Neuropeptides. 2002;36:77–84. - PubMed
    1. Voss-Andreae A., Murphy J.G., Ellacott K.L., Stuart R.C., Nillni E.A., Cone R.D. Role of the central melanocortin circuitry in adaptive thermogenesis of brown adipose tissue. Endocrinology. 2007;148:1550–1560. - PubMed

Publication types

MeSH terms