. 2019 Aug 15:197:13-23.
doi: 10.1016/j.neuroimage.2019.04.048. Epub 2019 Apr 20.

Visual temporal frequency preference shows a distinct cortical architecture using fMRI

Affiliations

Visual temporal frequency preference shows a distinct cortical architecture using fMRI

Yuhui Chai et al. Neuroimage. .

Abstract

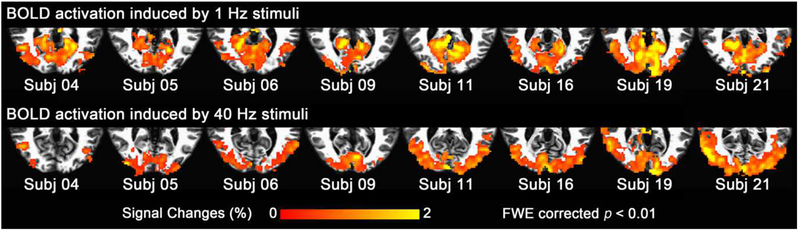
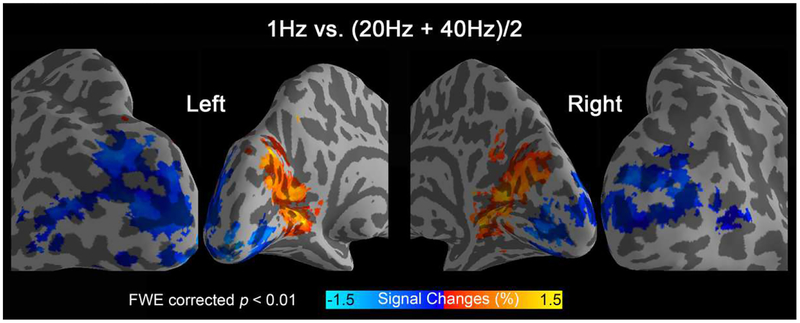
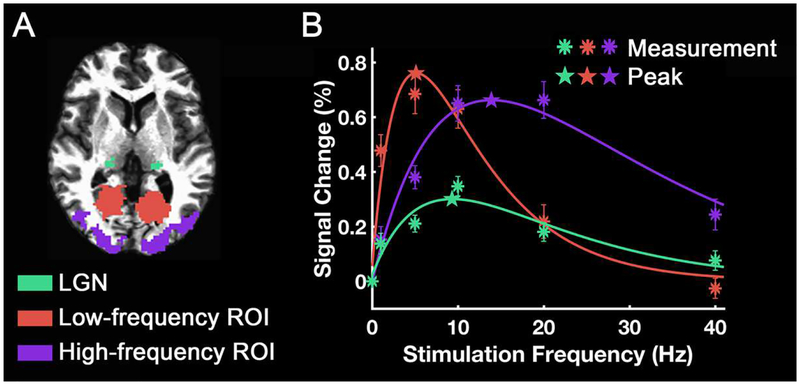
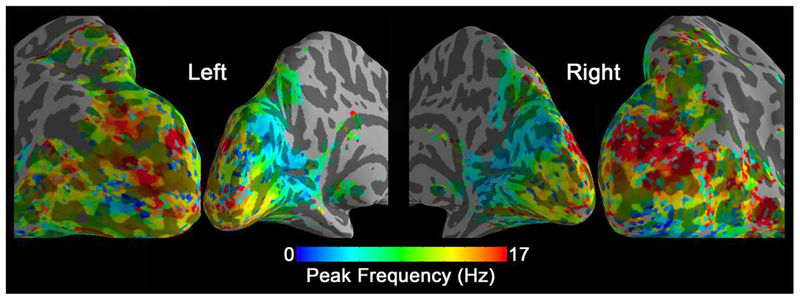
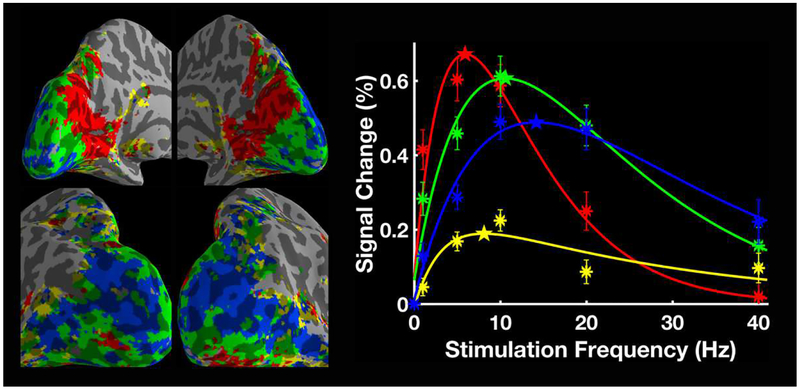
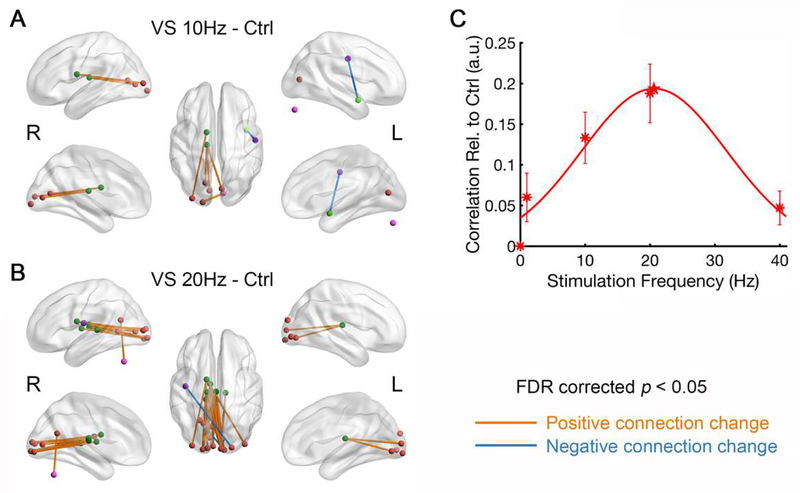
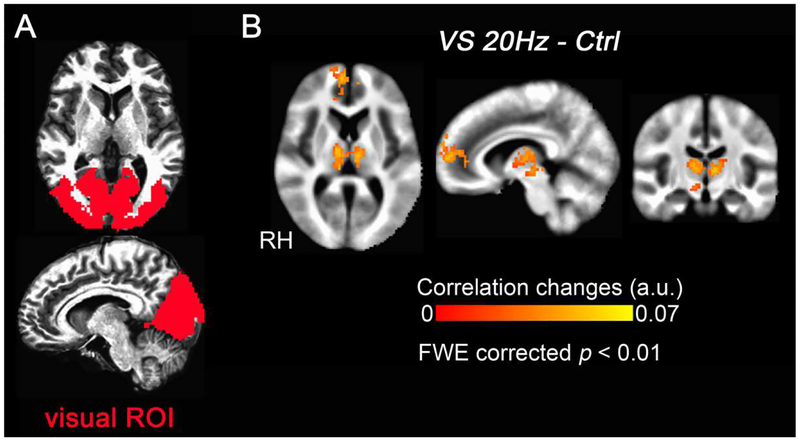
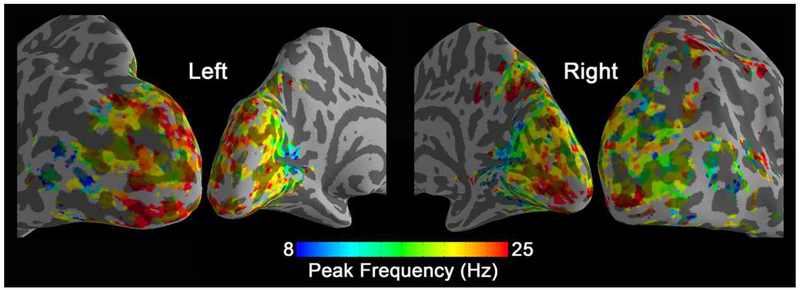
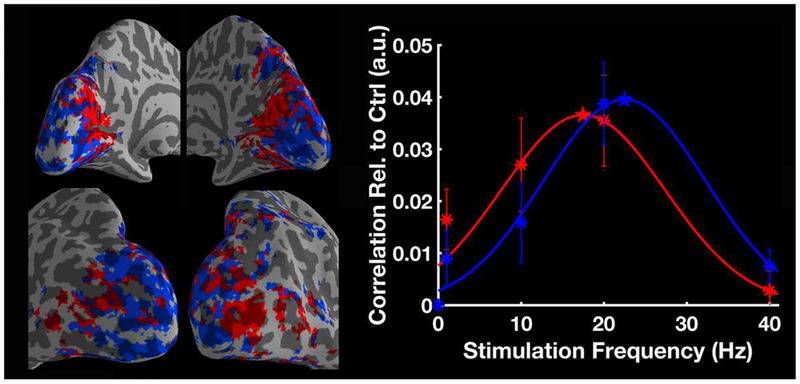
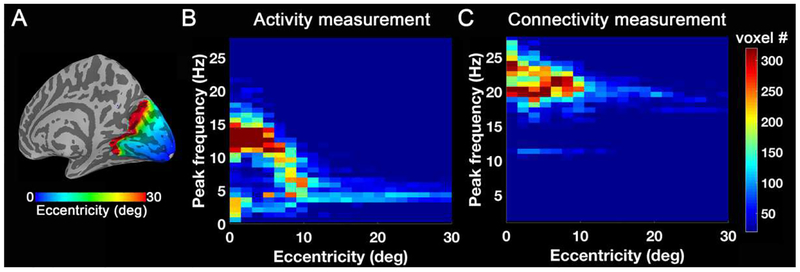
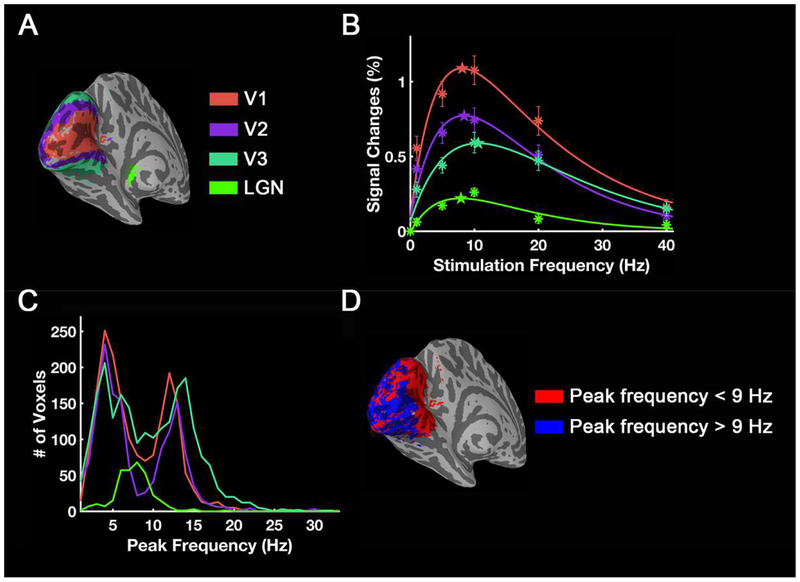
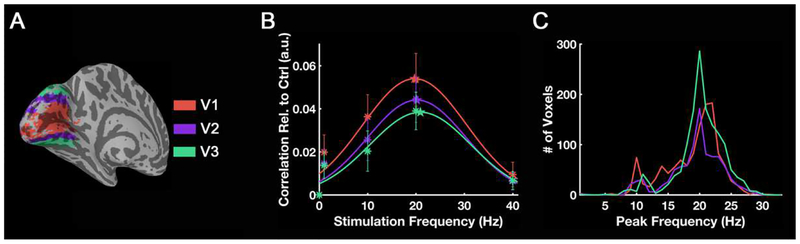
Studies of visual temporal frequency preference typically examine frequencies under 20 Hz and measure local activity to evaluate the sensitivity of different cortical areas to variations in temporal frequencies. Most of these studies have not attempted to map preferred temporal frequency within and across visual areas, nor have they explored in detail, stimuli at gamma frequency, which recent research suggests may have potential clinical utility. In this study, we address this gap by using functional magnetic resonance imaging (fMRI) to measure response to flickering visual stimuli varying in frequency from 1 to 40 Hz. We apply stimulation in both a block design to examine task response and a steady-state design to examine functional connectivity. We observed distinct activation patterns between 1 Hz and 40 Hz stimuli. We also found that the correlation between medial thalamus and visual cortex was modulated by the temporal frequency. The modulation functions and tuned frequencies are different for the visual activity and thalamo-visual correlations. Using both fMRI activity and connectivity measurements, we show evidence for a temporal frequency specific organization across the human visual system.

Keywords: Connectivity; Temporal frequency; Thalamo-visual correlation; Visual frequency; fMRI.


Figures

Figure 1.
Figure 1.
Activation maps from 8 representative subjects. The upper row shows that 1 Hz stimuli caused significant activation across most of the calcarine sulcus, while the bottom row shows that 40 Hz stimuli resulted in relatively more significant activation in lateral occipital cortex.
Figure 2.
Figure 2.
Group activation differences for low (1 Hz) vs. high (20 Hz and 40 Hz) frequency stimulation (17 subjects).
Figure 3.
Figure 3.
Frequency tuning curves of different ROIs. (A) ROI areas. (B) ROI-mean signal change was plotted as a function of stimulation frequency. The asterisks indicate the measured signal changes. The curves are the difference of exponential functions that best fit the data. The stars indicate the peak frequencies of each curve. The error bars indicate ± the standard error of the mean (SEM) across subjects (N = 17).
Figure 4.
Figure 4.
Peak frequency map of group-level BOLD signal changes (N=17). In each voxel, the peak frequency was generated by fitting the BOLD signal changes vs. temporal frequencies.
Figure 5.
Figure 5.
k-means parcellation (k = 4) based on group-level frequency-dependent BOLD signal changes (N=17). The mean BOLD signal changes for each cluster are plotted as a function of stimulation frequency. The asterisks indicate the measured signal changes and the stars mark the peak frequency of each curve. The error bars indicate ± SEM across all subjects.
Figure 6.
Figure 6.
Results of network statistical analysis and the tuning curve of thalamo-visual correlation (N = 20). Compared to control, visual stimulation at (A) 10 Hz and (B) 20 Hz significantly enhanced the connectivity between thalamus and visual cortex. The purple nodes outside of the brain are cerebellar region. (C) Mean correlation between thalamus and visual cortex (arbitrary unit, a.u.) was plotted as a function of stimulation frequency. The asterisks indicate the measured correlations relative to control and the curves are the Gaussian functions that best fit the data. The star indicates the peak frequency of the fitted curve. The error bars indicate ± SEM across subjects. R and L mark the side of left/right hemisphere.
Figure 7.
Figure 7.
Group-level correlation changes with the visual ROI (N = 20). (A) The activated visual occipital region that was defined as the visual ROI. (B) Compared with the control condition, visual stimulation at 20 Hz (VS 20Hz) significantly increased the correlation between the medial thalamus and the visual ROI. The medial frontal gyrus also shows significantly increased correlation with visual ROI. RH marks the side of right hemisphere.
Figure 8.
Figure 8.
Preferred frequency map of group-level correlation changes (N=20). In each voxel, the peak frequency was generated by fitting the frequency-dependent correlations with medial thalamus.
Figure 9.
Figure 9.
k-means parcellation based on frequency-dependent correlation changes to the thalamus at the group level (N=20). k = 2 was used and the mean correlation for each cluster was plotted as a function of stimulation frequency. The asterisks indicate the measured correlations relative to control, and the stars mark the peak frequency of each fitted curve. The error bars indicate ± SEM across subjects.
Figure 10.
Figure 10.
2D-histogram across eccentricity and peak frequency. (A) Eccentricity template from Benson et al. (2014). (B) Number of voxels as a function of eccentricity and peak frequency for the group-level preferred frequency map of BOLD signal changes. (C) Number of voxels as a function of eccentricity and peak frequency for the group-level preferred frequency map of correlation changes.
Figure 11.
Figure 11.
Frequency tuning curves and histograms across visual areas for group-level activation. (A) V1/2/3 were defined by taking the intersection of the visual areas template from Benson et al. (2014) and preferred frequency mapping regions. Using measured BOLD magnitude changes, frequency tuning curves for different visual areas are shown in (B), and the histogram (C) shows how many voxels have a specific peak frequency. The color of the curves and points correspond to different visual areas. Asterisks are the measured mean value from each visual area and the stars mark the peak frequency of each fitted curve. The error bars indicate ± SEM across subjects (N = 17). (D) Distribution of areas with preferred frequency < 9Hz and > 9Hz.
Figure 12.
Figure 12.
Frequency tuning curves and histograms across visual areas for group-level correlation. Based on the thalamo-visual correlation, frequency tuning curves for different visual areas are shown in (B), and the histogram (C) shows how many voxels have a specific peak frequency. The color of the curves and points correspond to different visual areas. Asterisks are the measured mean value from each visual area and the stars mark the peak frequency of each fitted curve. The error bars indicate ± SEM across subjects (N = 20).

References

    1. Allison JD, Smith KR, Bonds AB, 2001. Temporal-frequency tuning of cross-orientation suppression in the cat striate cortex. Vis Neurosci 18, 941–948. - PubMed
    1. Bayram A, Karahan E, Bilgic B, Ademoglu A, Demiralp T, 2016. Achromatic temporal-frequency responses of human lateral geniculate nucleus and primary visual cortex. Vision Res 127, 177–185. - PubMed
    1. Benson NC, Butt OH, Brainard DH, Aguirre GK, 2014. Correction of Distortion in Flattened Representations of the Cortical Surface Allows Prediction of V1-V3 Functional Organization from Anatomy. PLoS Comput Biol 10. - PMC - PubMed
    1. Buckner RL, Krienen FM, Yeo BT, 2013. Opportunities and limitations of intrinsic functional connectivity MRI. Nat Neurosci 16, 832–837. - PubMed
    1. Chen G, Saad ZS, Britton JC, Pine DS, Cox RW, 2013. Linear mixed-effects modeling approach to FMRI group analysis. Neuroimage 73, 176–190. - PMC - PubMed

Publication types