. 2019 Jul 25;134(4):395-406.
doi: 10.1182/blood.2018892752. Epub 2019 Apr 23.

Deficiency of adenosine deaminase 2 triggers adenosine-mediated NETosis and TNF production in patients with DADA2

Affiliations

Deficiency of adenosine deaminase 2 triggers adenosine-mediated NETosis and TNF production in patients with DADA2

Carmelo Carmona-Rivera et al. Blood. .

Abstract

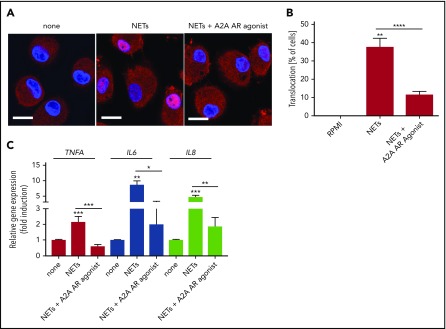
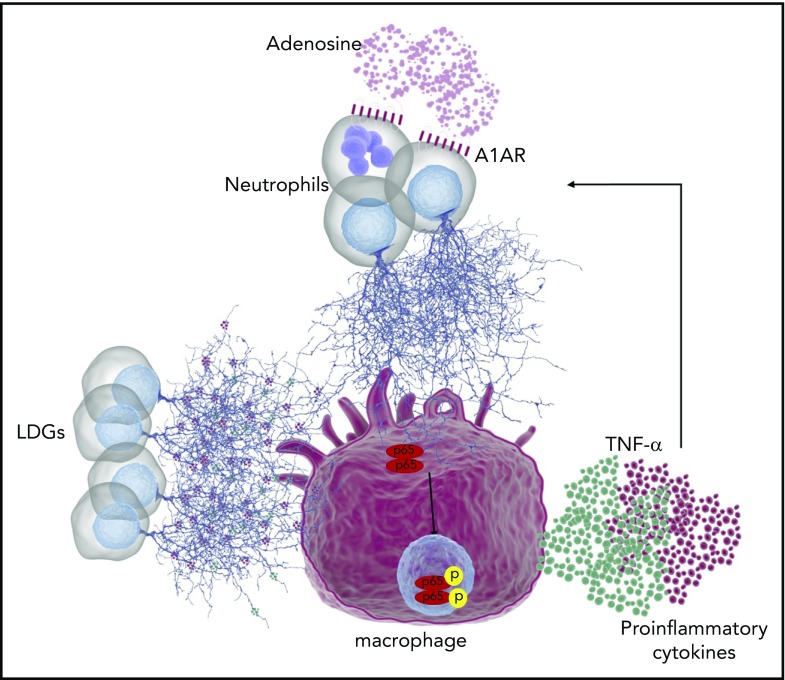
Reduction of adenosine deaminase 2 (ADA2) activity due to autosomal-recessive loss-of-function mutations in the ADA2 gene (previously known as CECR1) results in a systemic vasculitis known as deficiency of ADA2 (DADA2). Neutrophils and a subset of neutrophils known as low-density granulocytes (LDGs) have been implicated in the pathogenesis of vasculitis, at least in part, through the formation of neutrophil extracellular traps (NETs). The study objective was to determine whether neutrophils and NETs play a pathogenic role in DADA2. In vivo evidence demonstrated NETs and macrophages in affected gastrointestinal tissue from patients with DADA2. An abundance of circulating LDGs prone to spontaneous NET formation was observed during active disease in DADA2 and were significantly reduced after remission induction by anti-tumor necrosis factor (TNF) therapy. Increased circulating LDGs were identified in unaffected family members with monoallelic ADA2 mutations. Adenosine triggered NET formation, particularly in neutrophils from female patients, by engaging A1 and A3 adenosine receptors (ARs) and through reactive oxygen species- and peptidylarginine deiminase-dependent pathways. Adenosine-induced NET formation was inhibited by recombinant ADA2, A1/A3 AR antagonists, or by an A2A agonist. M1 macrophages incubated with NETs derived from patients with DADA2 released significantly greater amounts of TNF-α. Treatment with an A2AAR agonist decreased nuclear translocation of NF-κB and subsequent production of inflammatory cytokines in DADA2 monocyte-derived macrophages. These results suggest that neutrophils may play a pathogenic role in DADA2. Modulation of adenosine-mediated NET formation may contribute a novel and directed therapeutic approach in the treatment of DADA2 and potentially other inflammatory diseases.


Conflict of interest statement

Conflict-of-interest disclosure: The authors declare no competing financial interests.

Figures

None
Graphical abstract
Figure 1.
Figure 1.
NETs are present in DADA2-affected tissue and adenosine induces NET formation through NOX- and PAD-dependent pathways. (A) Hematoxylin-and-eosin (H&E) staining of small bowel tissue obtained from a patient with DADA2 shows neutrophilic infiltration in the wall of mesenteric arteries. (B) Neutrophil (arrows) infiltration in the appendix of a patient with DADA2. Red represents neutrophil elastase and blue is Hoechst. Scale bar, 100 µm. (C) Detection of NETs in a biopsy from a patient with DADA2. Red represents citrullinated histone H4 and blue is Hoechst. Scale bar, 100 µm. (D) LDGs were identified in patients with DADA2. LDGs per milliliter were significantly more abundant in patients with DADA2 during periods of disease activity (active, n = 4; remission, n = 10). LDGs from control (Ctrl; n = 2) and patients with SLE (n = 9) were used for comparison. (E) Adenosine levels were measured in plasma from patients with DADA2 (n = 9) and controls (n = 4). (F-G) Control neutrophils were incubated with different concentrations of adenosine (Ado) for 3 to 4 hours. Immunofluorescence shows that adenosine induces NET formation in control neutrophils, blue represent Hoechst; red is myeloperoxidase (MPO). Scale bar, 50 µm. Results are expressed as percentage of NETs (number of NETs/total number of neutrophils + NETs). **P < .01, Mann-Whitney U test. Results are the means ± standard error of the mean (SEM) of 4 independent experiments. (H) Control neutrophils were incubated in the presence or absence of NOX inhibitor (DPI; 5µM) or pan-PAD inhibitor (Cl-amidine, Cl-am; 20 µM) and stimulated with 16 µM adenosine (Ado). Phorbol myristate acid (PMA; 100 ng/mL) and calcium ionophore (Io; 2.5 µM) were used as positive controls. Results are expressed as percentage of NETs (number of NETs/total number of neutrophils + NETs). **P < .01, ***P < .001, Mann-Whitney U test. Results are the means ± SEM of n = 6. DMSO, dimethyl sulfoxide.
Figure 2.
Figure 2.
ADA2 decreases adenosine-induced NETs. Control neutrophils were incubated with different concentrations of adenosine (Ado) and in the presence or absence of 100 ng of recombinant ADA2 for 3 to 4 hours. (A) Percentage of NETs were graphed (number of NETs/total number of neutrophils + NETs). Results are the means ± SEM of n = 4, *P < .05, Mann-Whitney U test. (B) Representative confocal images after treatment with recombinant ADA2. Blue represents Hoechst; red is myeloperoxidase (MPO). Control neutrophils were incubated in the presence or absence of supernatant from control macrophages or DADA2 macrophages in the presence of adenosine. Scale bar, 50 µm. (C) ADA2 activity was measured in supernatants from control and DADA2 macrophages after 48-hour incubation. Results are the means ± SEM of n = 4, *P < .05, Mann-Whitney U test. (D) Representative confocal image of neutrophils treated with adenosine in the presence of macrophage supernatant from healthy volunteers or patients with DADA2. Scale bar, 50 µm. (E) Percentage of NETs were graphed (number of NETs/total number of neutrophils + NETs). Results are the means ± SEM of n = 3 to 4, *P < .05, Mann-Whitney U test. (F) Confocal images of DADA2 neutrophils treated with adenosine (Ado) in the presence or absence of human 100 ng of recombinant ADA1 (hrADA1) or ADA2 (hrADA2) for 3 to 4 hours. Blue represents Hoechst; red is myeloperoxidase (MPO). Scale bar, 50 µm. (G) ADA1 activity was measured for the human recombinant ADA1 used. N.D., not determined.
Figure 3.
Figure 3.
A1 and A3 ARs mediate adenosine-induced NETosis. Control neutrophils were incubated with adenosine (Ado) in the presence or absence of different AR antagonist for 3 to 4 hours. (A) Percentage of NETs was quantified (number of NETs/total number of neutrophils + NETs). Results are representative of 4 different experiments. (B) Representative confocal images of NET formation after treatment with an AR antagonist. Blue represents Hoechst; red is myeloperoxidase (MPO). Scale bar, 50 µm. (C) Neutrophils were incubated with adenosine, A1AR (5-deoxy-(±)-ENBA [Cl-ENBA]) or A3AR (MRS5698) agonists for 2 hours. NETs were quantified. (D-E) NETs were quantified after different concentrations of an A1AR agonist and/or in the presence of specific A1AR antagonists. *P < .05, **P < .01, ***P < .001, ****P < .0001, Mann-Whitney U test. Results are the means ± SEM of n = 4.
Figure 4.
Figure 4.
Sex differences in AR expression on neutrophils. ARs were detected in neutrophils from patients with DADA2. (A,D) Confocal analysis shows the presence of A1AR and A3AR (in red) in the plasma membrane of DADA2 neutrophils. Nuclei were stained in blue. Scale bar, 5 µm. (B) A1AR was analyzed in neutrophils from patients with DADA2 by flow cytometry. Three populations of A1AR were found in neutrophils from patients with DADA2. (C) Percentage of neutrophils with surface A1AR, classified as negative, low, and high. (E) A3AR was analyzed in neutrophils from patients with DADA2 by flow cytometry. (F) Percentage of neutrophil for A3AR. (G) A1AR and (H) A3AR were analyzed in neutrophils from healthy with by flow cytometry. *P < .05 Mann-Whitney U test.
Figure 5.
Figure 5.
NETs promote NF-κB nuclear translocation and stimulation of TNF-α release from macrophages. (A) Neutrophils and TNF-α were detected in tissue from a patient with DADA2. Red represents elastase; green is TNF-α; and blue is Hoechst. Scale bar, 100 µm. Control macrophages were incubated in presence of spontaneously generated NETs from LDGs or normal dense neutrophils from DADA2 patients or lipopolysaccharide (LPS) for 45 minutes to 2 hours. (B-C) Translocation of the NF-κB subunit p65 was assessed by immunofluorescence and quantified. LPS was used as positive control. Scale bar, 10 µm. (D) Levels of TNF-α in supernatants from control and DADA2 macrophages incubated with NETs for 48 hours were analyzed by enzyme-linked immunosorbent assay (ELISA). *P < .05, **P < .01, ****P < .0001, Mann-Whitney U test. Results are the means ± SEM of 6 independent experiments. (E) Macrophages and NETs detected in appendix tissue from a patient with DADA2. Red represents citrullinated histone H4; green is a marker for macrophages; and blue is Hoechst. Scale bar, 10 µm.
Figure 6.
Figure 6.
An A2AAR agonist decreases NF-κB nuclear translocation and NET-induced proinflammatory cytokine production in macrophages. Control macrophages were incubated with NETs in the presence or absence of A2AAR agonist. (A) Translocation of NF-κB (in red) was impaired in cells treated A2AAR agonist. Nuclei were stained in blue. Scale bar, 10 µm. (B) Translocation of NF-κB was quantified and graphed as a percentage of total cells. (C) Gene expression analysis shows A2AAR agonist significantly decreased NET-induced proinflammatory cytokine in macrophages. *P < .05, **P < .01, ***P < .001, ****P < .0001, Mann-Whitney U test. Results are the means ± SEM of n = 4-5.
Figure 7.
Figure 7.
Schematic representation of the role of neutrophil and macrophages in DADA2. Due to the lack of ADA2 activity in patients with DADA2, extracellular adenosine may accumulate. Elevated concentrations of adenosine can engage A1AR and/or A3AR in neutrophils leading to NET formation. In addition, LDGs present in patients with DADA2 release NETs spontaneously. Both sources of NETs can activate macrophages, leading to NF-κB translocation to the nucleus and activation of proinflammatory cytokines such as TNF-α and IL-6, among others. In turn, TNF-α can prime neutrophils to undergo further NETosis, leading to a vicious cycle.

Comment in

Similar articles

Cited by

References

    1. Ontyd J, Schrader J. Measurement of adenosine, inosine, and hypoxanthine in human plasma. J Chromatogr A. 1984;307(2):404-409. - PubMed
    1. Ramakers BP, Pickkers P, Deussen A, et al. . Measurement of the endogenous adenosine concentration in humans in vivo: methodological considerations. Curr Drug Metab. 2008;9(8):679-685. - PubMed
    1. Lazarowski ER, Boucher RC, Harden TK. Mechanisms of release of nucleotides and integration of their action as P2X- and P2Y-receptor activating molecules. Mol Pharmacol. 2003;64(4):785-795. - PubMed
    1. Haskó G, Cronstein B. Regulation of inflammation by adenosine. Front Immunol. 2013;4:85. - PMC - PubMed
    1. Barletta KE, Ley K, Mehrad B. Regulation of neutrophil function by adenosine. Arterioscler Thromb Vasc Biol. 2012;32(4):856-864. - PMC - PubMed

Publication types

MeSH terms

Supplementary concepts