. 2019 Jun;60(6):1087-1098.
doi: 10.1194/jlr.M091967. Epub 2019 Apr 23.

StarD5: an ER stress protein regulates plasma membrane and intracellular cholesterol homeostasis

Affiliations

StarD5: an ER stress protein regulates plasma membrane and intracellular cholesterol homeostasis

Daniel Rodriguez-Agudo et al. J Lipid Res. 2019 Jun.

Abstract

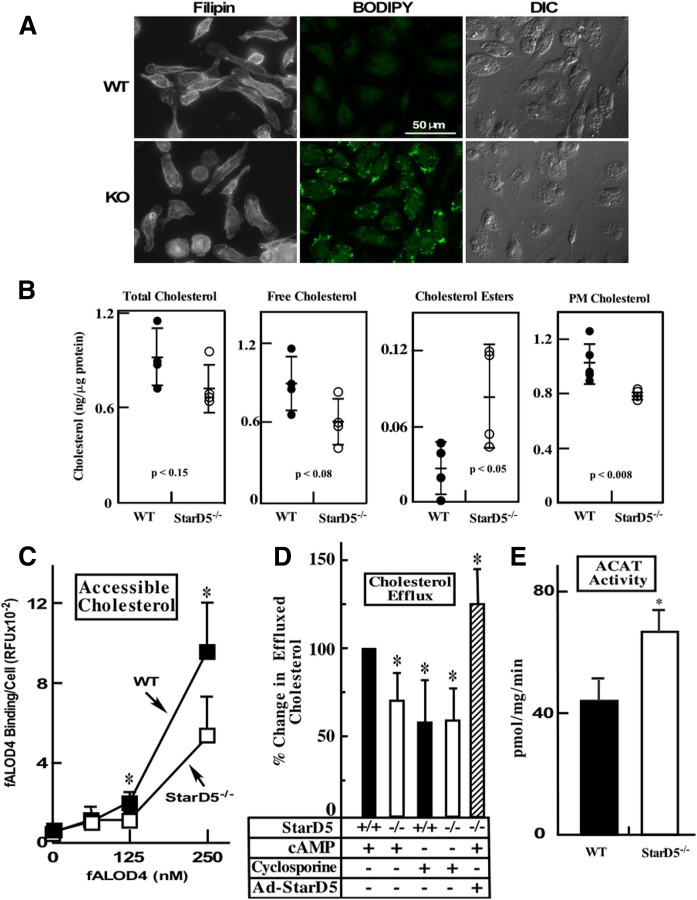
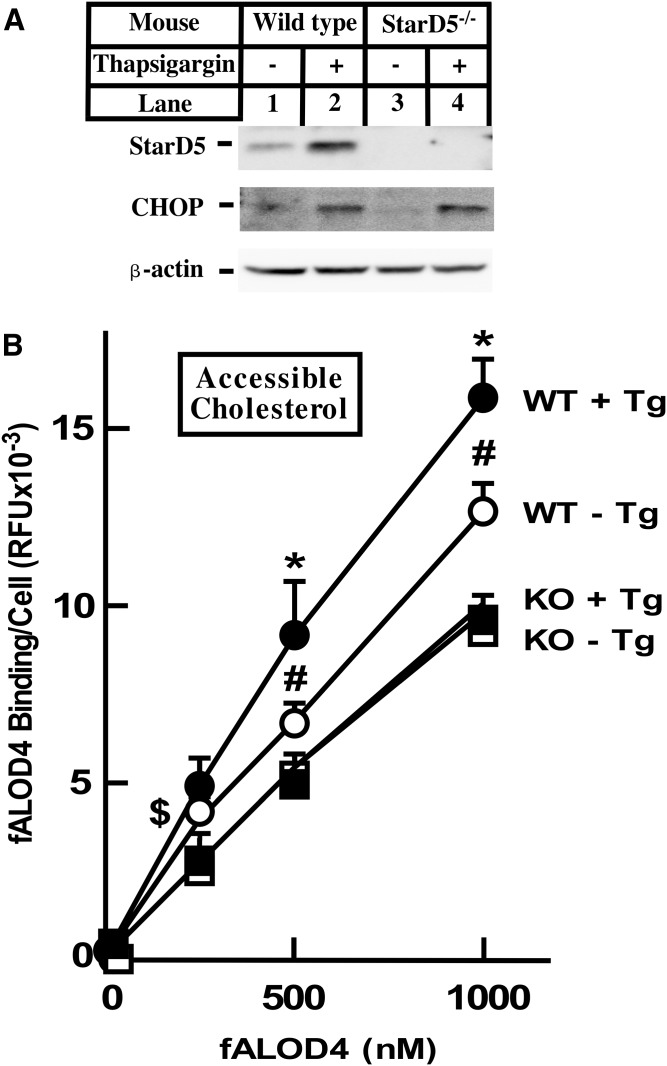
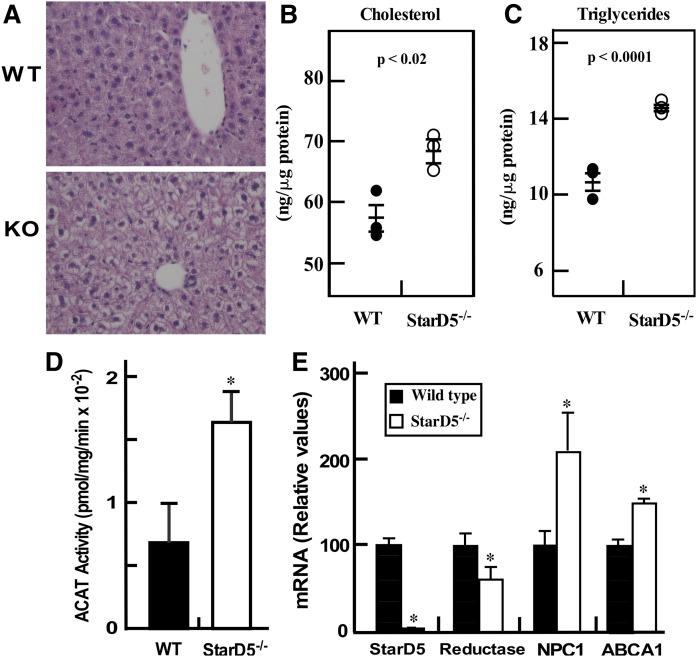
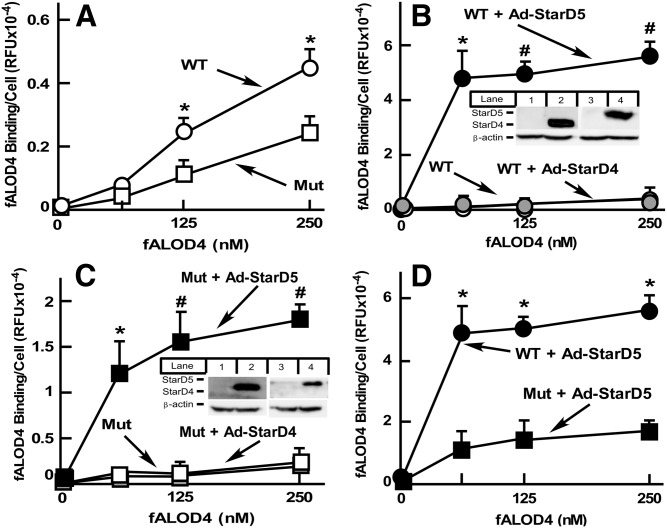
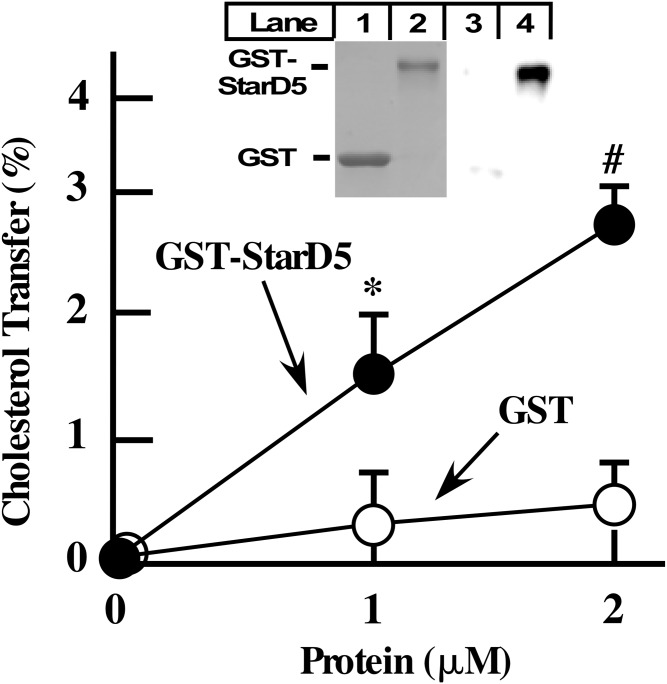
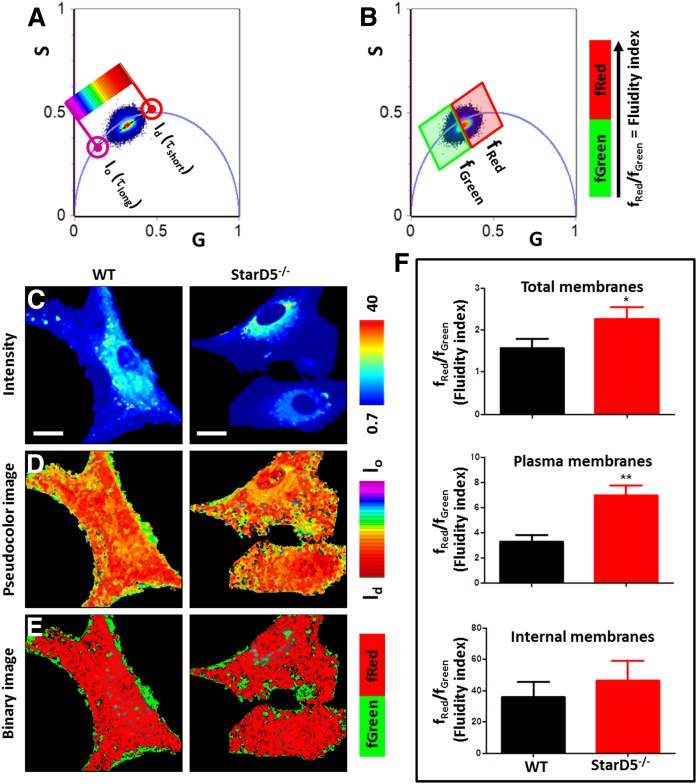
How plasma membrane (PM) cholesterol is controlled is poorly understood. Ablation of the gene encoding the ER stress steroidogenic acute regulatory-related lipid transfer domain (StarD)5 leads to a decrease in PM cholesterol content, a decrease in cholesterol efflux, and an increase in intracellular neutral lipid accumulation in macrophages, the major cell type that expresses StarD5. ER stress increases StarD5 expression in mouse hepatocytes, which results in an increase in accessible PM cholesterol in WT but not in StarD5-/- hepatocytes. StarD5-/- mice store higher levels of cholesterol and triglycerides, which leads to altered expression of cholesterol-regulated genes. In vitro, a recombinant GST-StarD5 protein transfers cholesterol between synthetic liposomes. StarD5 overexpression leads to a marked increase in PM cholesterol. Phasor analysis of 6-dodecanoyl-2-dimethylaminonaphthalene fluorescence lifetime imaging microscopy data revealed an increase in PM fluidity in StarD5-/- macrophages. Taken together, these studies show that StarD5 is a stress-responsive protein that regulates PM cholesterol and intracellular cholesterol homeostasis.

Keywords: Niemann-Pick C; cholesterol trafficking; endoplasmic reticulum; fatty liver; fluorescence; macrophages; steroidogenic acute regulatory protein-related lipid transfer proteins; steroidogenic acute regulatory-related lipid transfer domain 5.


Figures

Fig. 1.
Fig. 1.
StarD5 deletion lowers PM cholesterol in macrophages and ABCA1-dependent cholesterol efflux. A: Primary peritoneal macrophages from WT and StarD5−/− mice were imaged following staining with filipin and BODIPY 493-503, as indicated, as well as by differential interference contrast for those stained with BODIPY 493-503. B: Total, free, esterified, and PM cholesterol were quantified as described in the Materials and Methods (n = 4). C: Accessible PM cholesterol was quantified as described in the Materials and Methods (n = 3, *P ≤ 0.05 for WT versus StarD5−/−). D: Primary peritoneal macrophages from WT and StarD5−/− mice were used in cholesterol efflux assays as described in the Materials and Methods in the absence or presence of cAMP or cyclosporine A. Cholesterol efflux was calculated as the percentage of total cell 3H-cholesterol content, which was about 5% of the total cholesterol (total effluxed 3H-cholesterol + cell-associated 3H-cholesterol) and represented as a percentage of the effluxed cholesterol in WT macrophages in the presence of cAMP. Primary peritoneal macrophages from StarD5−/− mice infected with Ad-StarD5 (MOI of 200) were also used. The values represent the average ± SD (n = 4, *P < 0.05 with respect to the WT control). There was no significant difference in cholesterol effluxed from WT macrophages compared with StarD5−/− macrophages in the presence of cyclosporine A. E: Microsomes were prepared from WT and StarD5−/− macrophages (108 per condition) and ACAT activity was quantified as described in the Materials and Methods (n = 3, P < 0.05).
Fig. 2.
Fig. 2.
ER stress increases accessible PM cholesterol in WT mouse hepatocytes. Primary hepatocytes were isolated from WT and StarD5−/− mice as indicated in the Materials and Methods and incubated in 10% FBS-containing medium for 48 h. Then, the cells were incubated in the presence of 2 μM Tg or vehicle for 4 h, as indicated. A: A portion of the cells were used to extract total cellular protein and used in Western blots to quantify StarD5, CHOP, and β-actin. B: Accessible PM cholesterol was quantified as described in the Materials and Methods (n = 4, *P < 0.05 FOR WT + Tg/WT − Tg; #P < 0.005 for WT − Tg/KO − Tg; $P < 0.05 for WT − Tg/KO − Tg).
Fig. 3.
Fig. 3.
StarD5 deletion increases liver lipid content. A: Formalin-fixed sections from WT and StarD5−/− mouse livers were stained with H&E and visualized with a 40× objective using a Nikon Ti-U inverted microscope. Representative images from three mice are shown. (B and C) Liver total cholesterol (B) and triglycerides (C) were quantified as described in the Materials and Methods (n = 3). (D) Microsomes were prepared from WT and StarD5−/− livers and ACAT activity was quantified as described in the Materials and Methods (n = 3, P < 0.05). E: Total RNA was extracted from WT and StarD5−/− mouse livers and used in qRT-PCR as described in the Materials and Methods section, n = 3, *P < 0.05, WT compared with StarD5−/−.
Fig. 4.
Fig. 4.
StarD5 overexpression results in higher accessible PM cholesterol in CHO cells. A: WT CHO and NPC1 10-3 mutant cells, grown in 10% FBS-containing F12 medium. Accessible PM cholesterol was quantified as described in the Materials and Methods (n = 3, *P < 0.005, WT cells versus NPC1 mutant cells). B: WT CHO cells, noninfected or infected with the indicated virus (3,000 MOI), were harvested, incubated with fALOD4, and fluorescent intensity was quantified as in A (n = 3, *P < 0.005, #P < 0.00005 WT cells infected with Ad-StarD5 versus noninfected or infected with Ad-StarD4). A portion of the cells were used to extract total cellular protein and quantify either StarD4 (lanes 1 and 2) or StarD5 (lanes 3 and 4) by Western blots to assess protein expression (insert). C: CHO NPC1 mutant 10-3 cells were used instead of WT CHO cells, as in B (n = 3, *P < 0.005, #P < 0.0005 NPC1 mutant cells infected with Ad-StarD5 versus WT noninfected or infected with Ad-StarD4). (D) Data from the StarD5-infected cells from B and C is plotted together to show the different response to StarD5 overexpression in accessible PM cholesterol of CHO WT versus NPC1 mutant 10-3 cells (n = 3, *P < 0.0005, WT cells versus NPC1 mutant cells infected with Ad-StarD5).
Fig. 5.
Fig. 5.
StarD5 transfers cholesterol between membranes. Recombinant GST-human StarD5 protein (GST-StarD5) and GST as control were used in an in vitro cholesterol transfer assay between acceptor and donor liposomes as explained in the Materials and Methods (n = 3, *P < 0.05, P < 0.005 for GST-StarD5 versus GST at the indicated protein concentration). The insert shows the two proteins used in the assay visualized by Coomassie blue staining (lanes 1 and 2) and by Western blotting (lanes 3 and 4) using an anti-StarD5 antibody.
Fig. 6.
Fig. 6.
Phasor-FLIM of LAURDAN fluorescence in WT and StarD5−/−macrophages for blue-channel. A: Phasor distribution of LAURDAN fluorescence for WT and StarD5−/− macrophages. Red and purple cursors identify the trajectory for LAURDAN in cell membranes. The red cursor represents ld membranes (τshort = short lifetime) and the purple cursor represents lo membranes (τlong = long lifetime). Using a continuum cursor design the cells were masked based on their fluidity or the lo/ld ratio (D). B: Binary cursor selection for the fractional analysis of panel F. C: Representative intensity fluorescence images of WT and StarD5−/− macrophages. The bar at the left represents the intensity scale in counts. D: Pseudocolor images produced by the cursor code selection of panel A. The bar at the left represents the color scale used for the masking along the lo/ld ratio trajectory. E: Binary images produced by the cursor code selection in B. The bar at the left represents the color scale used for the binary masking. F: Analysis of number of pixels fraction for total, plasma, or internal membranes, respectively. The separation of plasma and internal membranes was done using masks. In the ratio analysis, we used more than 20 cells by group. *P < 0.05 and **P < 0.01, for WT versus StarD5−/−. Bars represent 20 μm.
Fig. 7.
Fig. 7.
Phasor-FLIM of LAURDAN fluorescence in WT and StarD5−/− macrophages for green-channel. A: Three cursors fraction histogram analysis on the phasor distribution for the green channel. The analysis calculates an area normalized number of pixels in the phasor distribution between red-green and red-blue cursors. We define the trajectory between red-green points as the dipolar relaxation axis and from red-blue points as the fluidity axis. The images can be colored by using the scale shown. The values for the G and S coordinates were calculated as detailed in the Materials and Methods section. B: Histograms of the pixel fraction distribution along the red-green trajectory for total membrane, PM, and internal membrane (IM), respectively, from left to right. C: Histogram of the pixel fraction distribution along the red-blue trajectory for total membrane, PM, and internal membrane (IM), respectively. D, E: Representative intensity fluorescence images of WT (D) and StarD5−/− (E) macrophages. The bar at the bottom represents the intensity scale in counts. F, G: Pseudocolor images produced by the cursor selection between red-green cursors (fluidity axis). The bar at the bottom represents the color scale used for the pseudo-coloring between the lo/ld trajectory. H, I: Pseudocolor images produced by the cursor selection between red-blue cursors (dipolar relaxation axis). The bar at the bottom represents the color scale used for the pseudo-coloring between low and high dipolar relaxation trajectory. The separation of plasma and internal membranes was done using masks. In the trajectory analysis, we used more than 20 cells by group. Bars represent 20 μm.

Similar articles

Cited by

References

    1. Brown M. S., and Goldstein J. L.. 1986. A receptor-mediated pathway for cholesterol homeostasis. Science. 232: 34–47. - PubMed
    1. Jacobs N. L., Andemariam B., Underwood K. W., Panchalingam K., Sternberg D., Kielian M., and Liscum L.. 1997. Analysis of a Chinese hamster ovary cell mutant with defective mobilization of cholesterol from the plasma membrane to the endoplasmic reticulum. J. Lipid Res. 38: 1973–1987. - PubMed
    1. Infante R. E., and Radhakrishnan A.. 2017. Continuous transport of a small fraction of plasma membrane cholesterol to endoplasmic reticulum regulates total cellular cholesterol. eLife. 6: e25466. - PMC - PubMed
    1. DeGrella R. F., and Simoni R. D.. 1982. Intracellular transport of cholesterol to the plasma membrane. J. Biol. Chem. 257: 14256–14262. - PubMed
    1. Simons K., and Ikonen E.. 2000. How cells handle cholesterol. Science. 290: 1721–1726. - PubMed

Publication types

MeSH terms