. 2019 Jun 3;151(6):850-859.
doi: 10.1085/jgp.201812237. Epub 2019 Apr 23.

A mutation in CaV2.1 linked to a severe neurodevelopmental disorder impairs channel gating

Affiliations

A mutation in CaV2.1 linked to a severe neurodevelopmental disorder impairs channel gating

Sidharth Tyagi et al. J Gen Physiol. .

Abstract

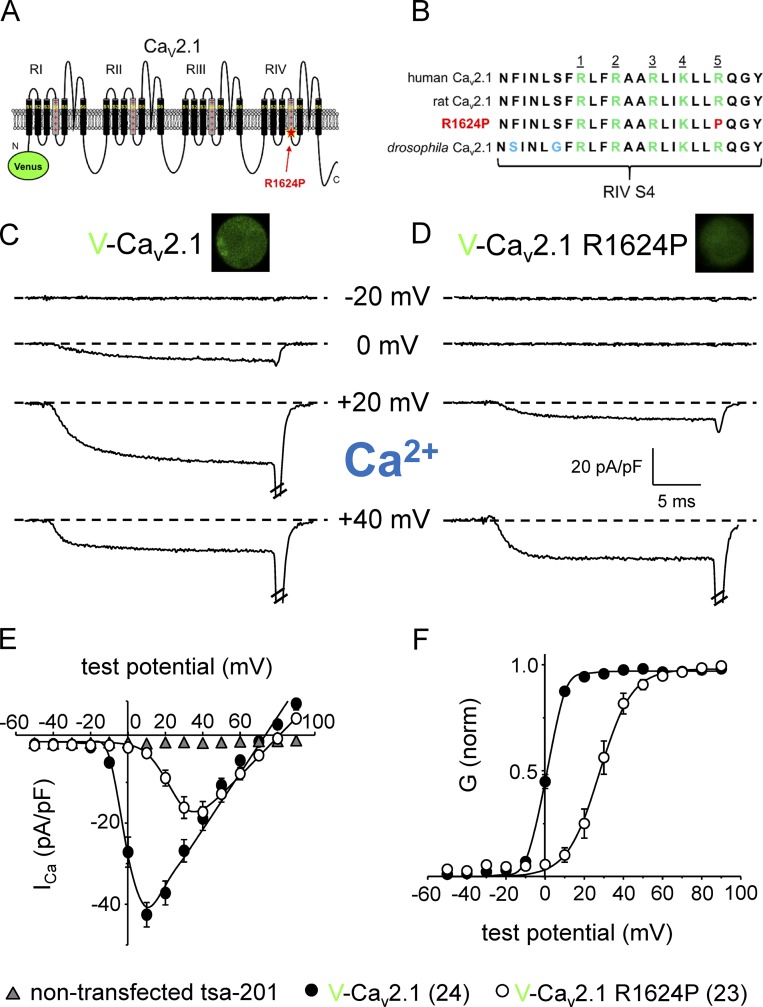
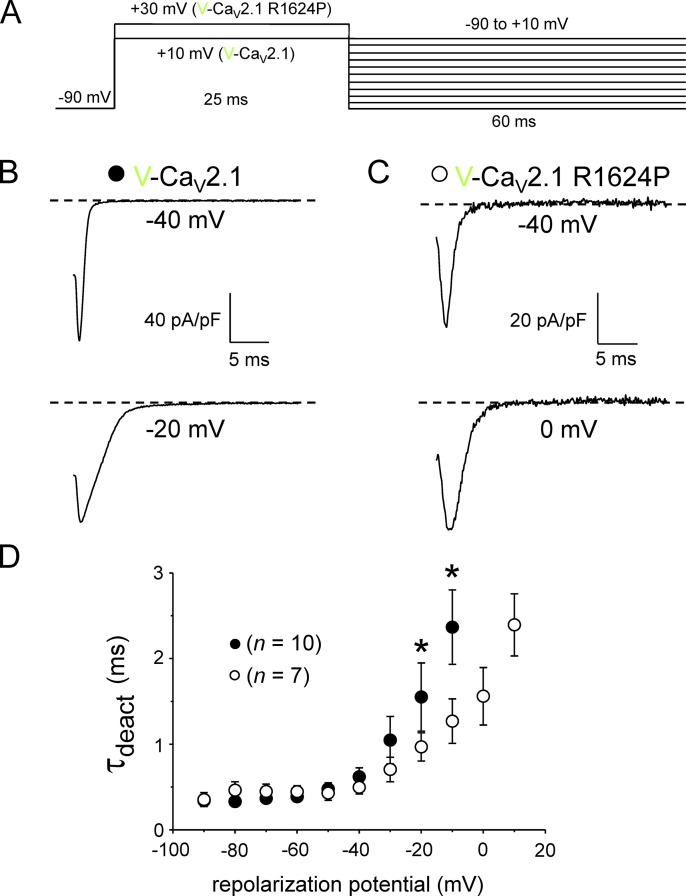
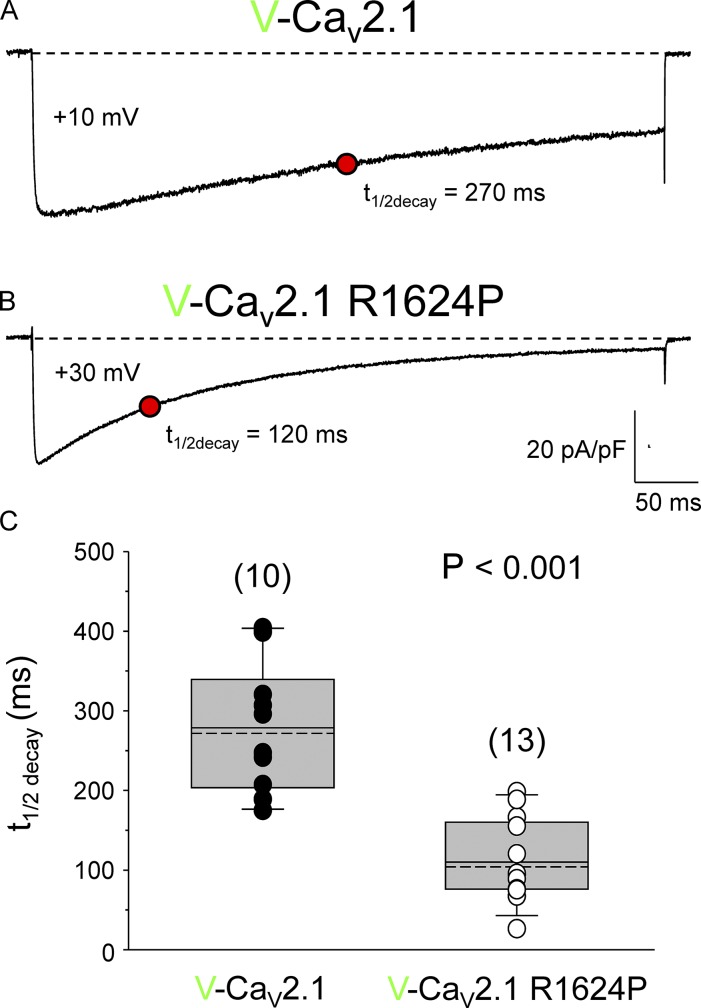
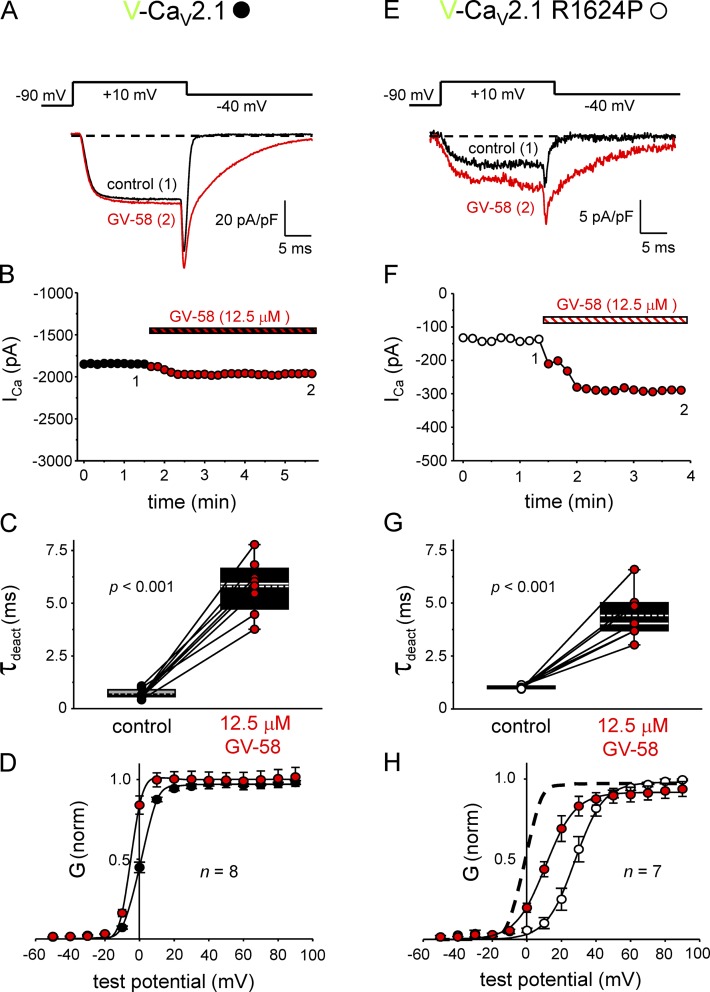
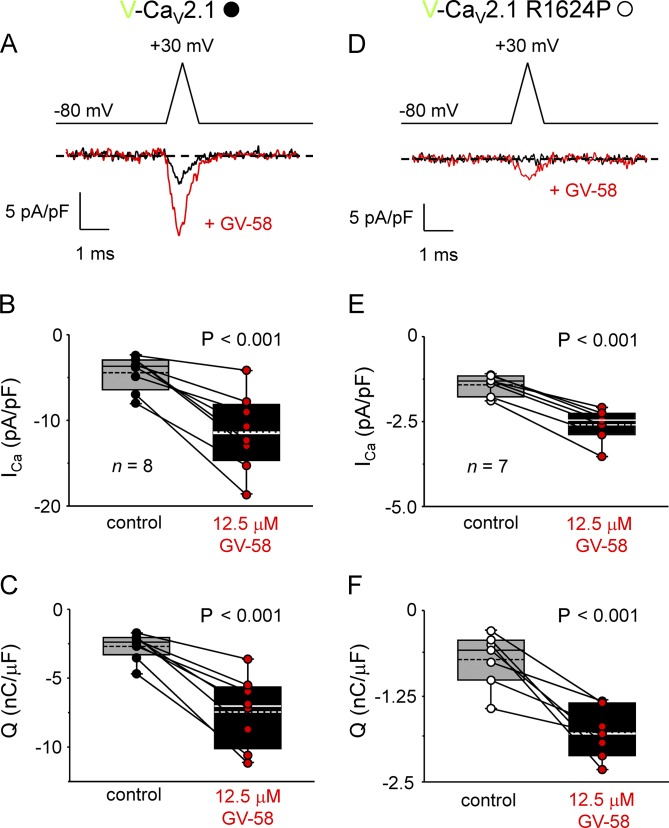
Ca2+ flux into axon terminals via P-/Q-type CaV2.1 channels is the trigger for neurotransmitter vesicle release at neuromuscular junctions (NMJs) and many central synapses. Recently, an arginine to proline substitution (R1673P) in the S4 voltage-sensing helix of the fourth membrane-bound repeat of CaV2.1 was linked to a severe neurological disorder characterized by generalized hypotonia, ataxia, cerebellar atrophy, and global developmental delay. The R1673P mutation was proposed to cause a gain of function in CaV2.1 leading to neuronal Ca2+ toxicity based on the ability of the mutant channel to rescue the photoreceptor response in CaV2.1-deficient Drosophila cacophony larvae. Here, we show that the corresponding mutation in rat CaV2.1 (R1624P) causes a profound loss of channel function; voltage-clamp analysis of tsA-201 cells expressing this mutant channel revealed an ∼25-mV depolarizing shift in the voltage dependence of activation. This alteration in activation implies that a significant fraction of CaV2.1 channels resident in presynaptic terminals are unlikely to open in response to an action potential, thereby increasing the probability of synaptic failure at both NMJs and central synapses. Indeed, the mutant channel supported only minimal Ca2+ flux in response to an action potential-like waveform. Application of GV-58, a compound previously shown to stabilize the open state of wild-type CaV2.1 channels, partially restored Ca2+ current by shifting mutant activation to more hyperpolarizing potentials and slowing deactivation. Consequently, GV-58 also rescued a portion of Ca2+ flux during action potential-like stimuli. Thus, our data raise the possibility that therapeutic agents that increase channel open probability or prolong action potential duration may be effective in combatting this and other severe neurodevelopmental disorders caused by loss-of-function mutations in CaV2.1.


Figures

Figure 1.
Figure 1.
The R1624P mutation causes a profound depolarizing shift in CaV2.1 activation. (A) Schematic representation of CaV2.1 with Venus fluorescent protein fused to the N terminus (V-CaV2.1). The R to P substitution at human residue 1,673 (rat residue 1,624) is indicated by the star. (B) Sequence comparison of the RIV S4 helices of human CaV2.1 (GenBank accession no. NM_000068) and rat CaV2.1 (GenBank accession no. NM_012918), rat CaV2.1 with the R to P substitution at the R5 position and Drosophila CaV2.1 (UniProtKB accession no. P91645). Basic residues in positions R0–R5 are shown in green (CaV2.1 RIV S4 lacks a basic residue in the nominal R0 position). Nonconserved residues are in blue. (C and D) Ca2+ current families recorded from tsA-201 cells expressing V-CaV2.1 (C) or V-CaV2.1 R1624P (D) with β4 and α2δ-1. Currents were elicited by 25-ms step depolarizations from −90 mV to the indicated test potentials; the repolarization voltage was −40 mV. (E) Comparison of V-CaV2.1 (●; n = 24) and V-CaV2.1 R1624P (○; n = 23) average peak I-V relationships. Currents were evoked at 0.1 Hz by test potentials ranging from −50 mV through +90 mV in 10-mV increments. Amplitudes were normalized by capacitance (pA/pF). I-V curves are plotted according to Eq. 1 with the following respective parameters for V-CaV2.1 and V-CaV2.1 R1624P: Gmax = 690 ± 30 and 560 ± 70 pS/pF, V1/2 = −0.9 ± 1.0 and 18.2 ± 1.6 mV, Vrev = 71.1 ± 2.6 and 77.7 ± 2.0 mV and k = 3.4 ± 0.8 and 6.2 ± 0.9 mV. (F) Normalized G-V relationships were fit with Eq. 2 with the following respective parameters for V-CaV2.1 and V-CaV2.1 R1624P: V1/2 = 2.3 ± 1.2 and 27.8 ± 2.1 mV; k = 4.3 ± 0.8 and 8.2 ± 1.2 mV. Error bars represent ±SEM.
Figure 2.
Figure 2.
The R1624P mutation causes a profound depolarizing shift in the activation of Ba2+ currents. (A and B) Ba2+ current families recorded from tsA-201 cells expressing V-CaV2.1 (A) or V-CaV2.1 R1624P (B) with β4 and α2δ-1. Currents were elicited by 25-ms-step depolarizations from −90 mV to the indicated potentials; the repolarization voltage was −40 mV. (C) Normalized G-V relationships were fit with Eq. 2 with the following respective parameters for V-CaV2.1 (●; n = 16) and V-CaV2.1 R1624P (○; n = 10): V1/2 = −8.9 ± 2.3 and 20.8 ± 2.7 mV; k = 6.9 ± 0.7 and 9.7 ± 0.4 mV. (D) Comparison of activation kinetics from tsA-201 cells expressing either V-CaV2.1 (●; n = 16) or V-CaV2.1 R1624P (○; n = 10). For both channels, the activation phase was fit by Eq. 3. Only test potentials in which a substantial amount of current was present are shown (i.e., ranging from 0 to 30 mV for V-CaV2.1 and 10 to 30 mV for V-CaV2.1 R1624P). Significant differences by two-tailed, unpaired t test are indicated (*, P < 0.05). Error bars represent ± SEM.
Figure 3.
Figure 3.
V-CaV2.1 R1624P deactivation kinetics. (A) Ba2+ tail currents were elicited by 60-ms repolarizations to test potentials ranging from −90 mV to +10 mV following a 25-ms depolarization from −90 mV to either +30 mV or +10 mV. (B and C) Representative Ba2+ tail currents recorded from tsA-201 cells expressing V-CaV2.1 (B) or V-CaV2.1 R1624P (C) following depolarization from either +10 mV for V-CaV2.1 or +30 mV for V-CaV2.1 R1624P to the indicated test potentials. (D) Comparison of deactivation kinetics from tsA-201 cells expressing either V-CaV2.1 (●; n = 10) or V-CaV2.1 R1624P (○; n = 7). For both channels, deactivation was fit by Eq. 4. Significant differences by two-tailed, unpaired t test are indicated (*, P < 0.05).
Figure 4.
Figure 4.
Open-state inactivation of CaV2.1 is accelerated by the R1624P mutation. (A and B) Representative Ba2+ currents recorded from tsA-201 cells expressing V-CaV2.1 (A) or V-CaV2.1 R1624P (B) near the peak of the I-V relationship for either channel. Currents were elicited by 500-ms depolarizations from −90 mV to +10 mV (A) and +30 mV (B). In both A and B, half-times of decay are indicated by the red dot. (C) Summary of half-times of current decay for V-CaV2.1 (●; n = 10) and V-CaV2.1 R1624P (○; n = 13). Means and medians are indicated by the dashed and solid black lines of the boxes, respectively. Boxes represent the 25th/75th percentiles. Bars represent the 5th/95th percentiles. A significant difference by two-tailed, unpaired t test is indicated (P < 0.001).
Figure 5.
Figure 5.
GV-58 promotes Ca2+ flux via both CaV2.1 and CaV2.1 R1624P. (A) Ca2+ currents recorded before (1) and during (2) application of 12.5 µM GV-58 to a tsA-201 cell expressing V-CaV2.1, β4, and α2δ-1. (B) Time course of step current amplitude before (black filled circles) and during (red filled circles) GV-58 application. Currents were evoked by the protocol illustrated in A at 0.1 Hz. Numbers correspond to traces shown in A. (C) Comparison of τdeact of V-CaV2.1 tail currents evoked by repolarization from +10 mV to −40 mV in the absence (black filled circles) or presence (red filled circles) of GV-58 (n = 8). (D) Normalized G-V relationships before and during application of GV-58. Currents were evoked at 0.1 Hz by test potentials ranging from −50 mV to +90 mV in 10-mV increments. G-V curves are plotted according to Eq. 2 with the respective parameters for control and GV-58: V1/2 = 1.7 ± 1.3 and −5.7 ± 2.8 mV and k = 4.8 ± 0.4 and 5.6 ± 0.8 mV. (E) Ca2+ currents recorded before (1) and during (2) application of 12.5 µM GV-58 to a tsA-201 cell expressing V-CaV2.1 R1624P, β4, and α2δ-1. (F) The corresponding time course. (G) Comparison of V-CaV2.1 R1624P deactivation upon repolarization from +10 mV to −40 mV in the absence (open circles) or presence (red circles) of GV-58 (n = 7). (H) Normalized G-V relationships for V-CaV2.1 R1624P before and during application of GV-58. The respective G-V fit parameters for control and GV-58 were V1/2 = 27.9 ± 2.2 and 10.8 ± 1.9 mV and k = 8.3 ± 0.4 and 8.6 ± 0.5 mV. For reference, the G-V curve for wild-type V-CaV2.1 in the absence of GV-58 is shown as a dashed black line. As in Figure 3, tail currents were fit by Eq. 4. Means and medians in C and G are indicated by the dashed and solid lines of the boxes, respectively. Boxes represent the 25th/75th percentiles. Bars represent the 5th/95th percentiles. In D and H, error bars represent ±SEM. Significant differences by two-tailed, paired t test are indicated.
Figure 6.
Figure 6.
GV-58 increases Ca2+ flux via V-CaV2.1 and V-CaV2.1 R1624P in response to an action potential–like waveform. (A and D) Ca2+ currents recorded before (1) and during (2) application of 12.5 µM GV-58 to tsA-201 cells expressing either V-CaV2.1 (A) or V-CaV2.1 R1624P (D). In both cases, Ca2+ currents were evoked by an action potential–like waveform similar to that used by Bahamonde et al. (2015). Specifically, this stimulus consisted of a 1-ms rising phase from −80 mV to +30 mV followed by a 1-ms decline back to −80 mV (illustrated in A and D, top). (B and C) Comparison of current amplitudes (B) and total charge flux (C) for cells expressing V-CaV2.1 in the absence (gray box) or presence (black box) of GV-58 (n = 8). (E and F) Comparison of current amplitudes (E) and total charge flux (F) for cells expressing V-CaV2.1 R1624P in the absence (gray box) or presence (black box) of GV-58 (n = 7). Means and medians are indicated by the dashed and solid lines of the boxes, respectively. Boxes represent the 25th/75th percentiles. Bars represent the 5th/95th percentiles. Significant differences by two-tailed, paired t test are indicated.

Similar articles

Cited by

References

    1. Bahamonde M.I., Serra S.A., Drechsel O., Rahman R., Marcé-Grau A., Prieto M., Ossowski S., Macaya A., and Fernández-Fernández J.M.. 2015. A single amino acid deletion (ΔF1502) in the S6 segment of CaV2.1 domain III associated with congenital ataxia increases channel activity and promotes Ca2+ influx. PLoS One. 10:e0146035 10.1371/journal.pone.0146035 - DOI - PMC - PubMed
    1. Beqollari D., and Kammermeier P.J.. 2013. The interaction between mGluR1 and the calcium channel Cav2.1 preserves coupling in the presence of long Homer proteins. Neuropharmacology. 66:302–310. 10.1016/j.neuropharm.2012.05.038 - DOI - PMC - PubMed
    1. Beqollari D., Romberg C.F., Filipova D., Papadopoulos S., and Bannister R.A.. 2015. Functional assessment of three Rem residues identified as critical for interactions with Ca(2+) channel β subunits. Pflugers Arch. 467:2299–2306. 10.1007/s00424-015-1700-x - DOI - PubMed
    1. Beqollari D., Dockstader K., and Bannister R.A.. 2018. A skeletal muscle L-type Ca2+ channel with a mutation in the selectivity filter (CaV1.1 E1014K) conducts K<sup/>. J. Biol. Chem. 293:3126–3133. 10.1074/jbc.M117.812446 - DOI - PMC - PubMed
    1. Bertone N.I., Groisman A.I., Mazzone G.L., Cano R., Tabares L., and Uchitel O.D.. 2017. Carbonic anhydrase inhibitor acetazolamide shifts synaptic vesicle recycling to a fast mode at the mouse neuromuscular junction. Synapse. 71:12 10.1002/syn.22009 - DOI - PubMed

Publication types

MeSH terms

Substances

Associated data