. 2019 Jun 3;216(6):1396-1410.
doi: 10.1084/jem.20180861. Epub 2019 Apr 23.

Hes1 attenuates type I IFN responses via VEGF-C and WDFY1

Affiliations

Hes1 attenuates type I IFN responses via VEGF-C and WDFY1

Fei Ning et al. J Exp Med. .

Abstract

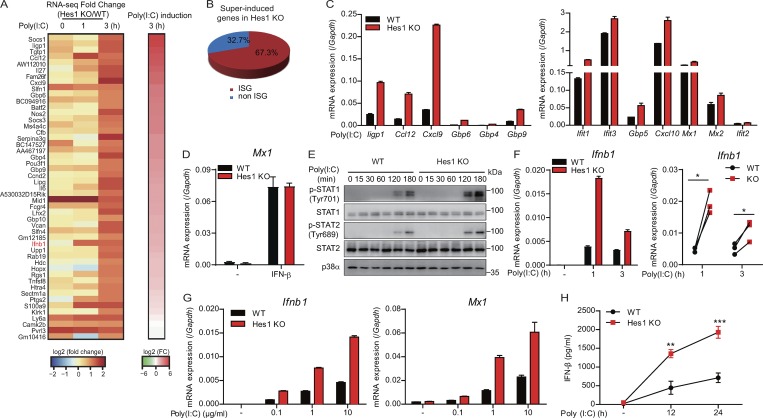
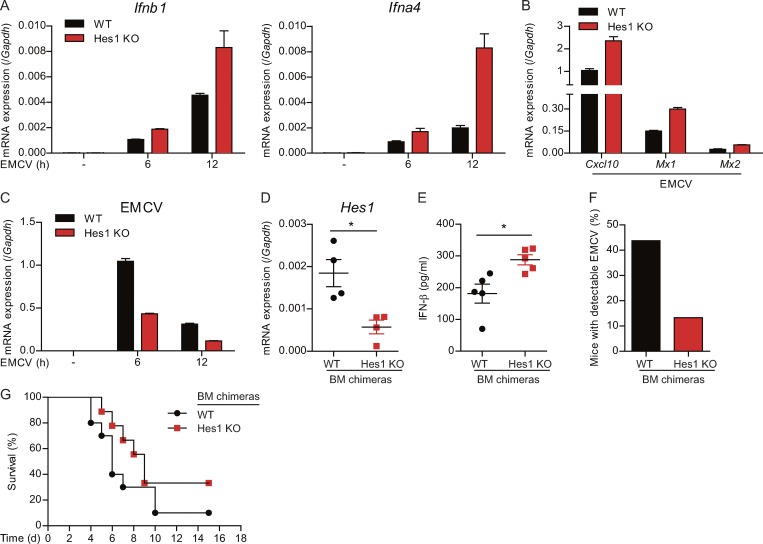
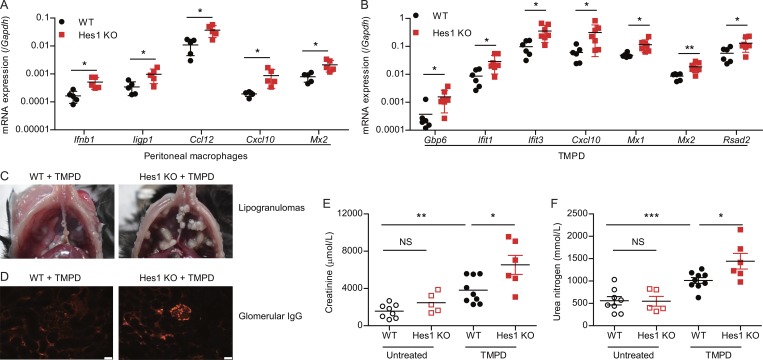
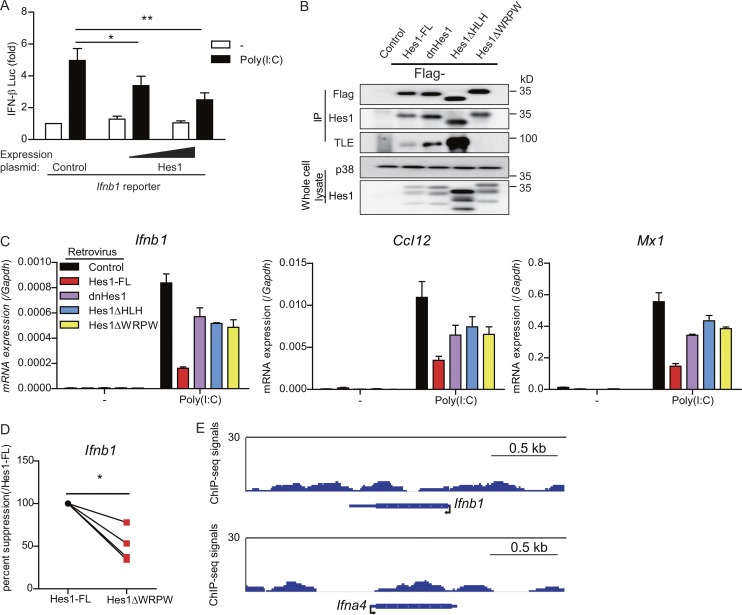
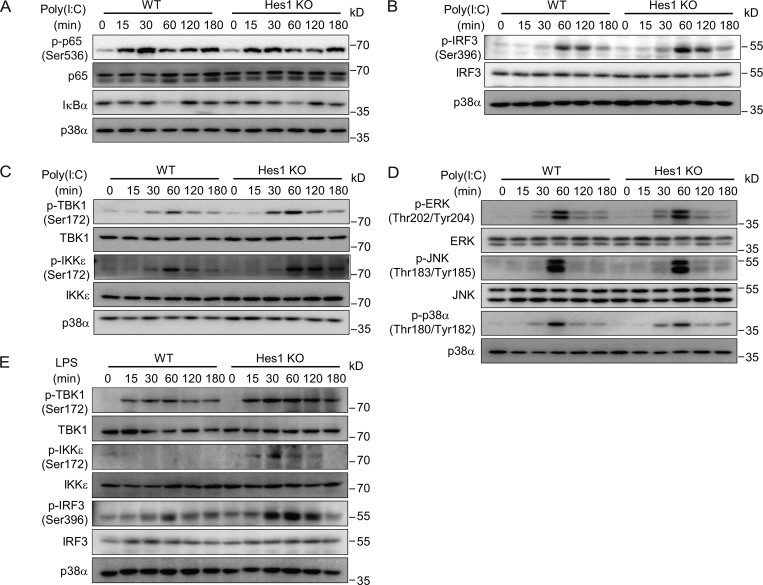
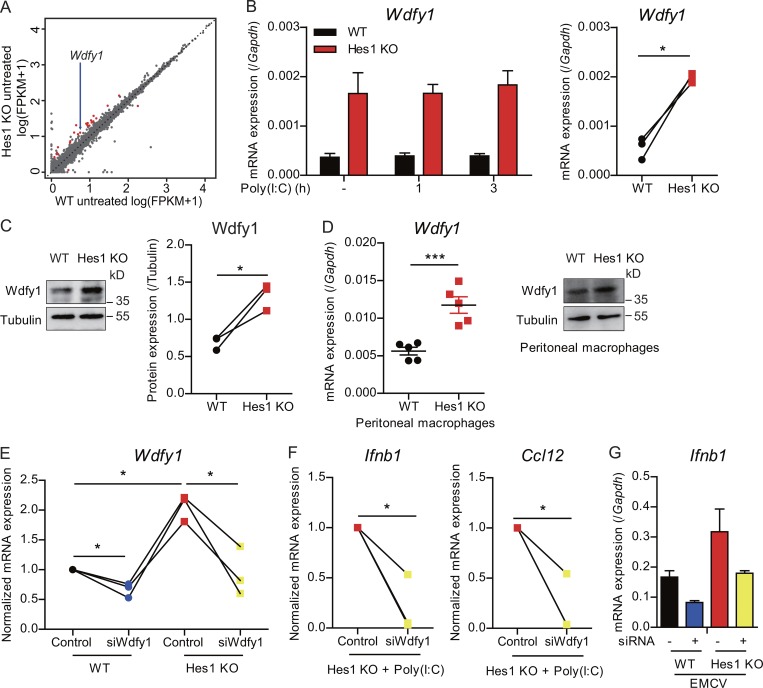
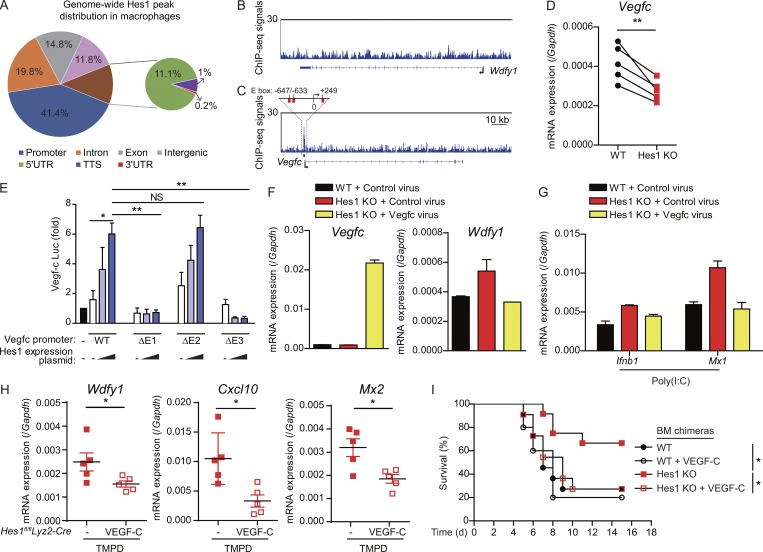
Induction of type I interferons (IFNs) is critical for eliciting competent immune responses, especially antiviral immunity. However, uncontrolled IFN production contributes to pathogenesis of autoimmune and inflammatory diseases. We found that transcription factor Hes1 suppressed production of type I IFNs and expression of IFN-stimulated genes. Functionally, Hes1-deficient mice displayed a heightened IFN signature in vivo, mounted enhanced resistance against encephalomyocarditis virus infection, and showed signs of exacerbated experimental lupus nephritis. Mechanistically, Hes1 did not suppress IFNs via direct transcriptional repression of IFN-encoding genes. Instead, Hes1 attenuated activation of TLR upstream signaling by inhibition of an adaptor molecule, WDFY1. Genome-wide assessment of Hes1 occupancy revealed that suppression of WDFY1 was secondary to direct binding and thus enhancement of expression of VEGF-C by Hes1, making Vegfc a rare example of an Hes1 positively regulated gene. In summary, these results identified Hes1 as a homeostatic negative regulator of type I IFNs for the maintenance of immune balance in the context of antiviral immunity and autoimmune diseases.


Figures

Figure 1.
Figure 1.
Hes1 deficiency results in enhanced TLR3-induced expression of type I IFN and ISGs. (A) Heatmap of superinduced genes by poly(I:C) in Hes1fl/flCre-ERT2 (Hes1 KO) BMDMs versus Hes1+/+Cre-ERT2 (WT) cells. BMDMs were stimulated without or with 1 µg/ml poly(I:C) for the indicated periods. Ifnb1 in listed genes is highlighted in red. FC, fold change. (B) Percentage of ISGs (defined on the Interferome database) among all superinduced genes by poly(I:C) at 3 h in Hes1 KO BMDMs. (C) qPCR analysis of ISG mRNA in WT and Hes1 KO BMDMs stimulated with poly(I:C) for 3 h. (D) qPCR analysis of Mx1 in WT and Hes1 KO BMDMs stimulated with IFN-β (10 U/ml) for 3 h. (E) Immunoblotting analysis of phosphorylated (p-) and total STAT1 (Tyr701) and STAT2 (Tyr689) in whole-cell lysates of WT and Hes1 KO BMDMs stimulated with poly(I:C) for various times (top lanes). Levels of p38α served as loading controls. (F) qPCR analysis of Ifnb1 in WT and Hes1 KO BMDMs stimulated with poly(I:C) for various times (left). Cumulative results of Ifnb1 expression are shown (right). (G) qPCR analysis of Ifnb1 and Mx1 in WT and Hes1 KO BMDMs stimulated with various concentrations of poly(I:C) (horizontal axes) for 2 h. (H) ELISA of IFN-β in supernatant of WT and Hes1 KO BMDMs stimulated with poly(I:C) for various times (horizontal axes). Data are representative of one (A and B) or three independent experiments (C–E, F [left], and G; mean + SD of technical triplicates in C, D, F [left], and G) or are pooled from three (F [right] and H; mean ± SD in H) independent experiments. *, P < 0.05; **, P < 0.01; ***, P < 0.001 (Student’s t test).
Figure 2.
Figure 2.
Hes1 deficiency protects against EMCV infection in vitro and in vivo. (A) qPCR analysis of Ifnb1 and Ifna4 in Hes1+/+Cre-ERT2 (WT) and Hes1fl/flCre-ERT2 (Hes1 KO) BMDMs infected with EMCV (MOI = 10) for the indicated periods. (B and C) qPCR analysis of ISGs (B) and EMCV replication (C) in WT and Hes1 KO BMDMs infected with EMCV (MOI = 10) for 6 h. (D) qPCR analysis of mRNA expression of Hes1 in bone marrow cells from WT and Hes1 KO chimeric mice. (E and F) ELISA of IFN-β in serum (E) or percentage of mice with detectable EMCV in heart (F) of WT and Hes1 KO chimeric mice at day 4 after infection with a sublethal dose of EMCV (MOI = 5). (G) Survival rate of age-matched and sex-matched chimeras of WT (n = 10) and Hes1 KO (n = 9) infected with a lethal dose of EMCV (MOI = 6.6). Data are representative of two (A–C, E, and F; mean + SD of technical triplicates in A–C and mean ± SEM in E) or three (D and G; mean ± SEM in D) independent experiments. Each symbol represents an individual mouse. *, P < 0.05 (Student’s t test).
Figure 3.
Figure 3.
Hes1 deficiency promotes the IFN signature and exacerbates lupus nephritis. (A) qPCR analysis of Ifnb1 and a subset of ISGs in peritoneal macrophages from Hes1+/+Cre-ERT2 (WT, n = 5) and Hes1fl/flCre-ERT2 (Hes1 KO, n = 5) mice. (B) qPCR analysis of ISGs in peritoneal cells from WT (n = 6) and Hes1 KO (n = 7) mice treated with TMPD (0.5 ml per mouse) for 2 wk. (C and D) Photographs of lipogranulomas in peritoneal cavity (C) or immunofluorescence of glomerular deposition of IgG in kidney (D) in WT and Hes1 KO mice 14 wk after TMPD treatment. (E and F) Quantitative analysis of creatinine (E) and urea nitrogen (F) in urine samples from untreated WT (n = 8) and Hes1 KO (n = 5) mice or from WT (n = 9) and Hes1 KO (n = 6) mice 14 wk after TMPD (0.5 ml per mouse) treatment. Scale bars, 20 µm. Data are representative of two (C and D) independent experiments or pooled from two (A, B, E, and F; mean ± SEM) independent experiments. Each symbol represents an individual mouse. *, P < 0.05; **, P < 0.01; ***, P < 0.001 (Student’s t test).
Figure 4.
Figure 4.
Hes1 inhibits Ifnb1 expression via its key functional domains. (A) Luciferase activities in RAW 264.7 cells cotransfected with an Ifnb1 promoter-driven reporter construct and a Hes1 expression plasmid or control empty vector. 18 h after transfection, cells were left untreated or stimulated with 10 µg/ml poly(I:C) for 8 h, and cell lysates were analyzed for luciferase activity. (B) Immunoblotting (IB) analysis of indicated proteins in immunoprecipitated (IP) samples and whole-cell lysates of HEK 293T cells that overexpressed WT Hes1 or Hes1 mutants. (C) qPCR analysis of Ifnb1 and related genes (Ccl12 and Mx1) in WT BMDMs transduced with control retroviruses or retroviruses expressing Hes1 or Hes1 mutants, subsequently with or without 1 µg/ml poly(I:C) stimulation for 3 h. (D) Percent suppression of Ifnb1 in BMDMs expressing Hes1ΔWRPW relative to results obtained for cells expressing Hes1-FL (set as 100). Cells were stimulated with poly(I:C) for 1 h. (E) ChIP-seq analysis of Hes1 occupancy along gene loci of Ifnb1 (top) and Ifna4 (bottom) in BMDMs. Data are representative of one (E), two (B), or three (C; mean + SD of technical triplicates) independent experiments or pooled from three independent experiments (A and D; mean + SD in A). *, P < 0.05; **, P < 0.01 (Student’s t test).
Figure 5.
Figure 5.
Hes1 inhibits activation of TLR–IRF3 signaling cascades. (A–D) Immunoblotting analysis of phosphorylated (Ser536) and total p65 and total IκBα (A); phosphorylated (Ser396) and total IRF3 (B); phosphorylated (Ser172) and total TBK1 and IKKε (C); and phosphorylated (Thr202/Tyr204, Thr183/Tyr185, and Thr180/Tyr182) and total ERK, JNK, and p38α (D) in whole-cell lysates of BMDMs obtained from Hes1+/+Cre-ERT2 (WT) and Hes1fl/flCre-ERT2 (Hes1 KO) mice and treated for various times (above lanes) with poly(I:C) (1 µg/ml). (E) Immunoblotting analysis of phosphorylated and total TBK1, IKKε, and IRF3 in whole cell lysates of WT and Hes1 KO BMDMs treated with LPS (10 ng/ml) for various times. Data are representative of three independent experiments (A–E).
Figure 6.
Figure 6.
Hes1 represses Wdfy1 expression to regulate TLR-induced IFNs. (A) Scatter blot of RNA-seq analysis of differentially expressed genes in Hes1+/+Cre-ERT2 (WT) and Hes1fl/flCre-ERT2 (Hes1 KO) BMDMs at basal levels. Wdfy1 was marked with an arrow. (B) qPCR analysis of Wdfy1 mRNA in WT and Hes1 KO BMDMs stimulated with 1 µg/ml poly(I:C) (left) for indicated periods (horizontal axes), and cumulative results for induction of Wdfy1 in WT and Hes1 KO cells under unstimulated condition (right). (C) Immunoblotting analysis of protein expression of Wdfy1 in resting WT and Hes1 KO BMDMs (left) and cumulative results of Wdfy1 expression were shown as in right. Levels of tubulin served as loading controls. (D) qPCR analysis of Wdfy1 mRNA expression (left) and immunoblotting analysis of Wdfy1 protein levels (right) in peritoneal macrophages from WT and Hes1 KO mice. (E–G) qPCR analysis of Wdfy1, Ifnb1, or ISG expression in BMDMs from indicated mice transfected with siWdfy1 or control siRNA. Cells were without (E) or with poly(I:C) stimulation for 1 h (F) or with EMCV infection for 6 h (G). Data are representative of one (A) or three (B [left], C [left], D [right], and G; mean + SD of technical triplicates in B [left] and G) independent experiments or pooled from three (B [right], C [right], E, and F) or five (D [left]; mean ± SEM) independent experiments. Each symbol represents an individual mouse. *, P < 0.05; ***, P < 0.001 (Student’s t test).
Figure 7.
Figure 7.
Hes1 promotes Vegfc transcription to suppress Wdfy1 expression. (A) Genome-wide analysis of Hes1 binding peak distribution in gene loci in unstimulated BMDMs. UTR, untranslated region; TTS, transcription termination site. (B and C) ChIP-seq analysis of Hes1 occupancy along gene loci of Wdfy1 (B) and Vegfc (C) in macrophages. (D) qPCR analysis of Vegfc expression in Hes1+/+Cre-ERT2 (WT) and Hes1fl/flCre-ERT2 (Hes1 KO) BMDMs. (E) Luciferase activities in CMT93 cells cotransfected with WT or E box mutant Vegfc promoter-driven reporter constructs and a Hes1 expression plasmid or control empty vector. 18 h after transfection, cell lysates were analyzed for luciferase activity. (F and G) qPCR analysis of Vegfc and Wdfy1 expression in WT or Hes1 KO BMDMs transduced with control or Vegfc-expressing (yellow bar) virus in the unstimulated condition (F) or Ifnb1 and Mx1 expression in these cells stimulated with poly(I:C) for 1 h (G). (H) qPCR analysis of Wdfy1, Cxcl10, and Mx2 in peritoneal cells from Hes1fl/flLyz2-Cre mice treated with TMPD for 7 d with or without VEGF-C pretreatment. (I) Survival of WT and Hes1 KO chimeras infected with EMCV with or without VEGF-C pretreatment (WT and Hes1 KO + VEGF-C, n = 11; WT + VEGF-C, n = 5, Hes1 KO, n = 12). Data are representative of one experiment (A–C) or three (F and G; mean + SD of technical triplicates) independent experiments or pooled from two (H and I; mean ± SEM in H), three (E; mean + SD), or five (D) independent experiments. Each symbol represents an individual mouse. *, P < 0.05; **, P < 0.01 (Student’s t test or log-rank test in I).

Similar articles

Cited by

References

    1. Alvarez Y., Municio C., Hugo E., Zhu J., Alonso S., Hu X., Fernández N., and Sánchez Crespo M.. 2011. Notch- and transducin-like enhancer of split (TLE)-dependent histone deacetylation explain interleukin 12 (IL-12) p70 inhibition by zymosan. J. Biol. Chem. 286:16583–16595. 10.1074/jbc.M111.222158 - DOI - PMC - PubMed
    1. Arisi I., D’Onofrio M., Brandi R., Felsani A., Capsoni S., Drovandi G., Felici G., Weitschek E., Bertolazzi P., and Cattaneo A.. 2011. Gene expression biomarkers in the brain of a mouse model for Alzheimer’s disease: mining of microarray data by logic classification and feature selection. J. Alzheimers Dis. 24:721–738. 10.3233/JAD-2011-101881 - DOI - PubMed
    1. Bennett J.A., Singh K.P., Unnisa Z., Welle S.L., and Gasiewicz T.A.. 2015. Deficiency in Aryl Hydrocarbon Receptor (AHR) Expression throughout Aging Alters Gene Expression Profiles in Murine Long-Term Hematopoietic Stem Cells. PLoS One. 10:e0133791 10.1371/journal.pone.0133791 - DOI - PMC - PubMed
    1. Boxx G.M., and Cheng G.. 2016. The Roles of Type I Interferon in Bacterial Infection. Cell Host Microbe. 19:760–769. 10.1016/j.chom.2016.05.016 - DOI - PMC - PubMed
    1. Buscarlet M., and Stifani S.. 2007. The ‘Marx’ of Groucho on development and disease. Trends Cell Biol. 17:353–361. 10.1016/j.tcb.2007.07.002 - DOI - PubMed

Publication types

MeSH terms