. 2019 Jul;180(3):1709-1724.
doi: 10.1104/pp.19.00086. Epub 2019 Apr 23.

Modeling Protein Destiny in Developing Fruit

Affiliations

Modeling Protein Destiny in Developing Fruit

Isma Belouah et al. Plant Physiol. 2019 Jul.

Abstract

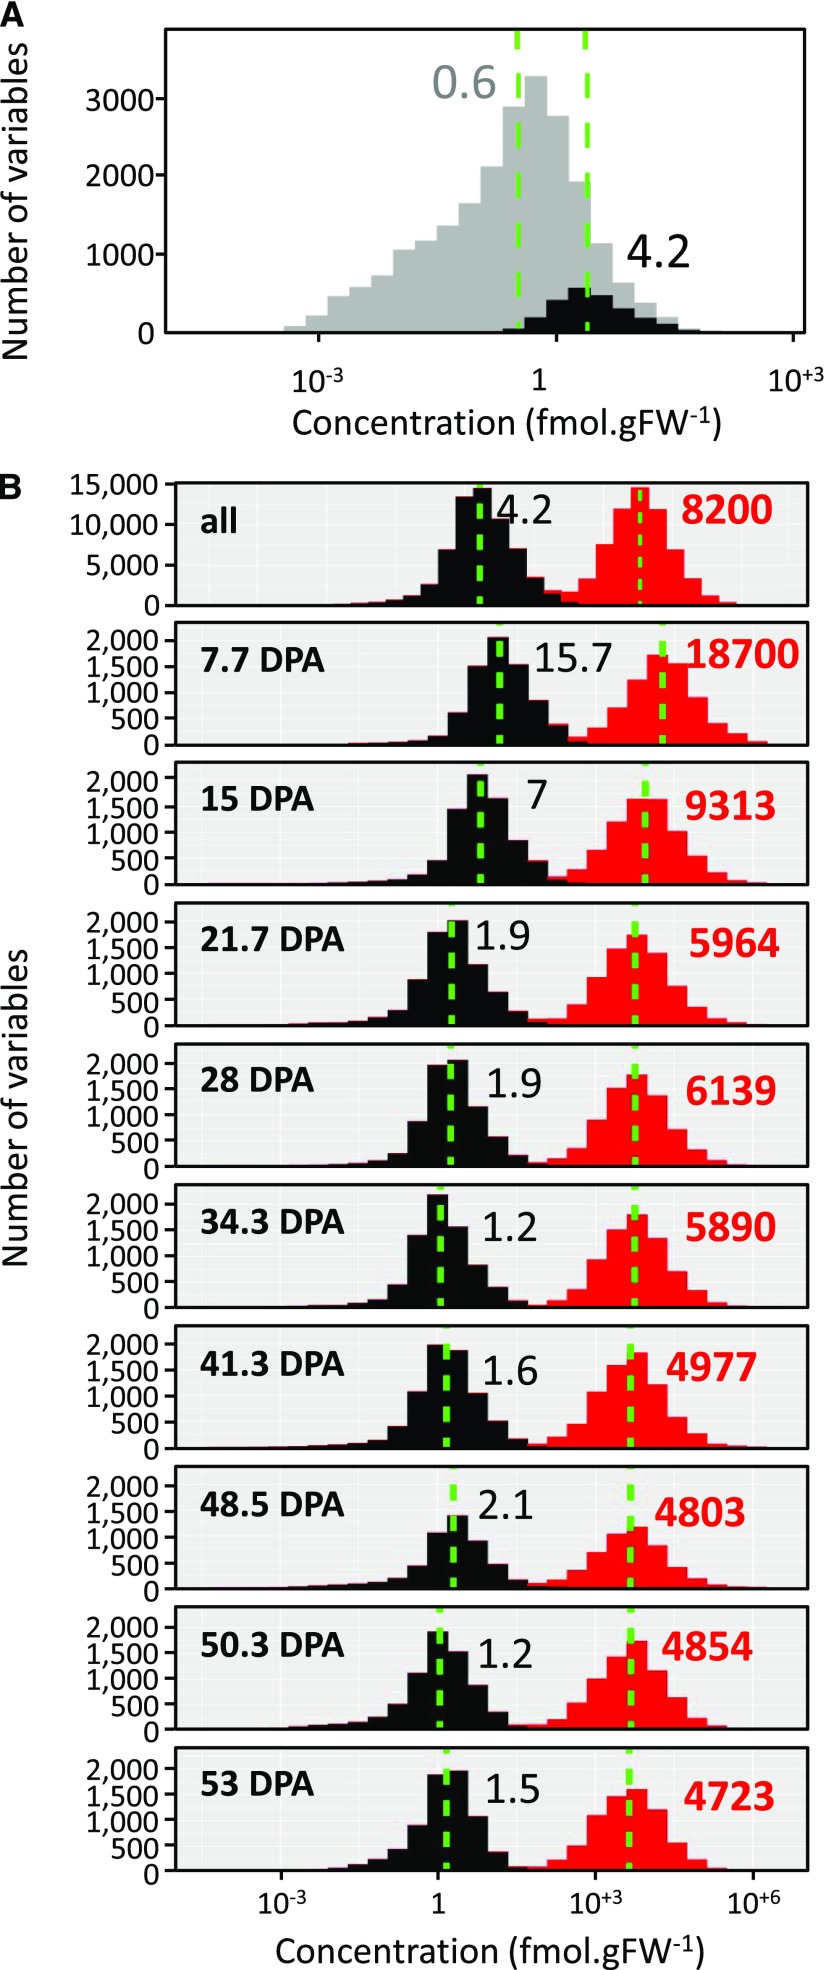
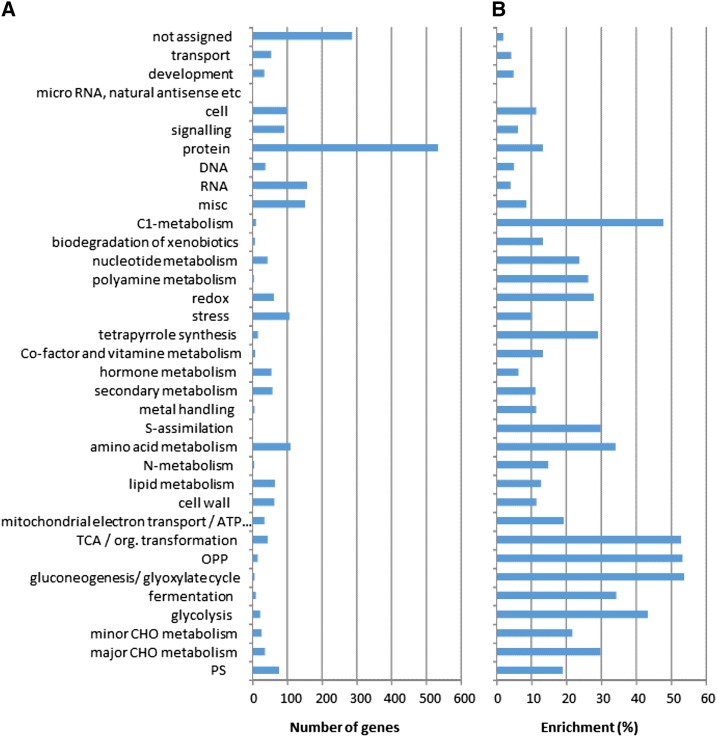
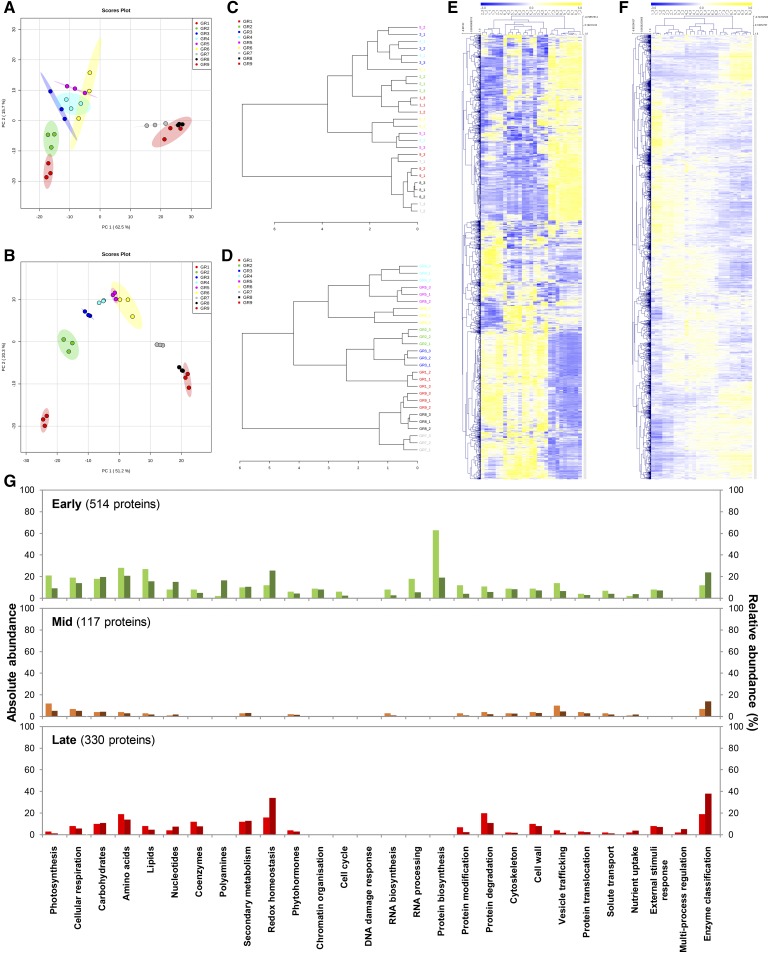
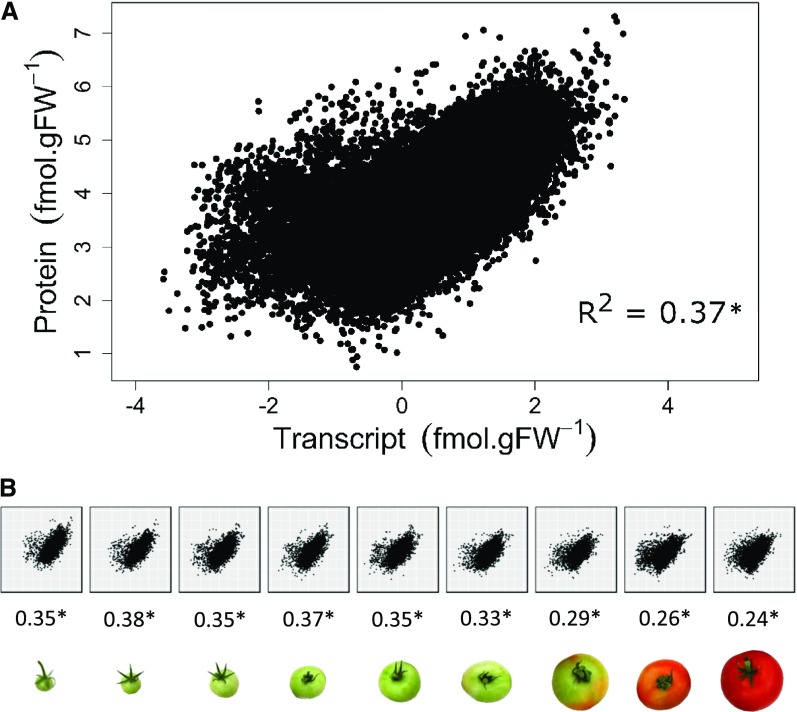
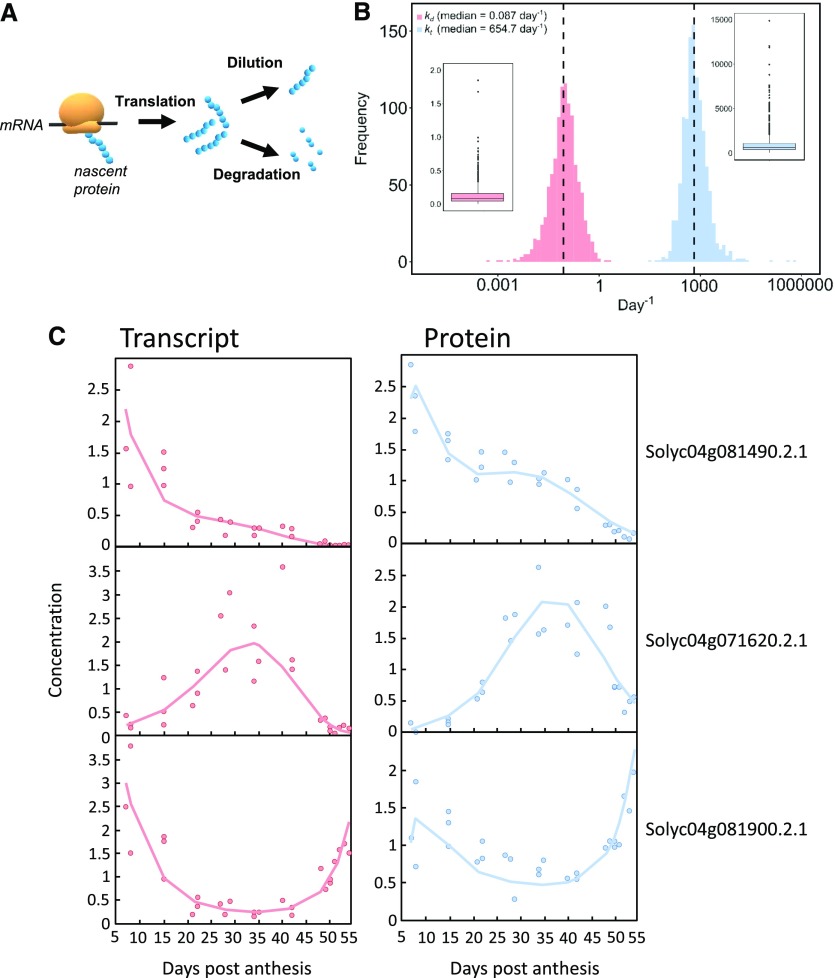
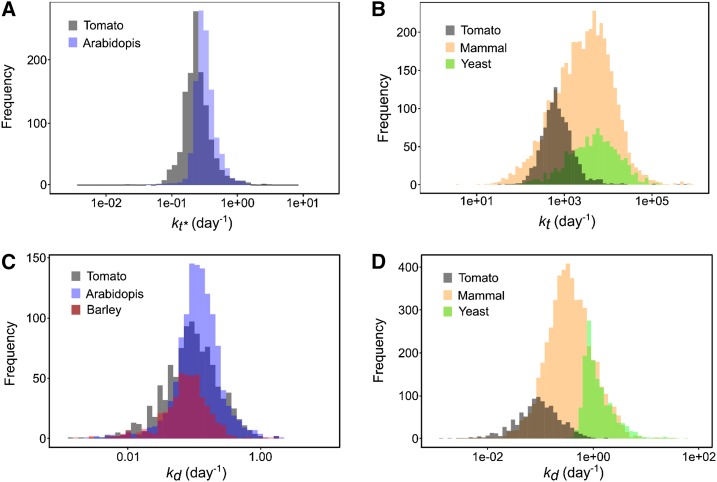
Protein synthesis and degradation are essential processes that regulate cell status. Because labeling in bulky organs, such as fruits, is difficult, we developed a modeling approach to study protein turnover at the global scale in developing tomato (Solanum lycopersicum) fruit. Quantitative data were collected for transcripts and proteins during fruit development. Clustering analysis showed smaller changes in protein abundance compared to mRNA abundance. Furthermore, protein and transcript abundance were poorly correlated, and the coefficient of correlation decreased during fruit development and ripening, with transcript levels decreasing more than protein levels. A mathematical model with one ordinary differential equation was used to estimate translation (kt ) and degradation (kd ) rate constants for almost 2,400 detected transcript-protein pairs and was satisfactorily fitted for >1,000 pairs. The model predicted median values of ∼2 min for the translation of a protein, and a protein lifetime of ∼11 d. The constants were validated and inspected for biological relevance. Proteins involved in protein synthesis had higher kt and kd values, indicating that the protein machinery is particularly flexible. Our model also predicts that protein concentration is more strongly affected by the rate of translation than that of degradation.


Figures

Figure 1.
Figure 1.
Distribution of transcript and protein concentrations. A, Transcripts, all (22,877) in gray and the ones corresponding to the proteins (2,375) in black. B, Transcripts (gray) versus proteins (red) for all stages combined and at each of the nine stages of tomato fruit development identified by time (in days post anthesis [DPA]). Dashed green lines symbolize medians in all panels. Median values are shown in black for mRNA and in red for protein. FW, fresh weight.
Figure 2.
Figure 2.
Enrichment of MapMan categories. A, Number of genes corresponding to proteins detected within each functional category. B, Ratio between detected and nondetected proteins (enrichment expressed in %). TCA, tricarboxylic acid cycle; OPP, oxydative pentose phosphate; CHO, carbohydrate.
Figure 3.
Figure 3.
Multi- and univariate statistical analyses reveal differential induction patterns for transcript and protein abundances during fruit development. Abundance data of transcripts and proteins that paired together (2,375) were normalized before statistical analyses (median normalization, cube-root transformation, Pareto scaling). A and B, Global overview of unfiltered transcriptomic (A) and proteomic (B) profiles by PCA (n = 3; max variance explained is shown in brackets) indicates stage-specific responses during fruit growth. C and D, Dendrograms showing relationship between transcript (C) and protein (D) samples (Pearson’s correlation) confirmed multivariate outputs from PCA. E and F, Bidimensional clustering analysis of transcript (E) and protein (F) profiles (Pearson’s correlation) revealing distinct abundance patterns. G, Protein profiles were filtered by ANOVA (P < 0.01 with adjusted Bonferroni) yielding 1,363 proteins, then subsequently clustered by Pearson’s correlation (see Supplemental Fig. S2), which revealed three main clusters: “Early” (514 proteins), “Mid” (117), and “Late” (330). Proteins that paired with transcripts, or belonging to the different clusters, were mapped to metabolic function using Mercator4 (v1.0). For each metabolic function, absolute (left bars, light colors) and relative (right bars, dark colors) abundances are shown on the left and right axes, respectively.
Figure 4.
Figure 4.
Correlation between 2,375 protein and transcript abundancies during fruit development. A, Correlation plot obtained for all stages. B, Correlation plots obtained at each of the nine stages identified by stage of fruit development. Correlation coefficients (R2) are given below each plot. Data were log-transformed before analysis.
Figure 5.
Figure 5.
Mathematical model of protein translation and degradation. A, Scheme of the main processes described in the mathematical model. B, Distribution and boxplot of both rate constants for translation (kt) and degradation (kd) that were satisfactorily fitted with the model for 1,103 proteins. C, Three satisfactorily fitted profiles of transcripts and proteins, for which protein peaks occurred at early, mid, and late stages of fruit development. Symbols correspond to transcript (red) and protein (blue) normalized experimental data. The red lines represent the fitting of the mRNA data and the blue line the fitting of the protein data.
Figure 6.
Figure 6.
Comparison of rate constants between organisms. A, Distribution of 1,103 translation rate constants kt* calculated for proteins of tomato fruit (gray, median 0.31 d−1) superimposed with 1,228 values from Arabidopsis leaf (blue, median 0.23 d−1; Li et al., 2017). B, Distribution of 1,103 translation rate constants kt calculated for proteins of tomato fruit (gray, median 772 d−1) superimposed with 1,115 values of yeast (green, median 4,930 d−1; Lahtvee et al., 2017) and 4,247 values of mammal cells (yellow, median 2,981 d−1; Schwanhäusser et al., 2011). C and D, Distribution of 1,103 degradation rate constants kd calculated for proteins of tomato fruit (gray median 0.113 d−1) superimposed with (C) 1,228 values from Arabidopsis leaf (blue, median 0.113 d−1; Li et al., 2017) and 505 values from barley leaf (purple, median 0.076 d−1; Nelson et al., 2014) and with (D) 1,384 values of yeast (green, median 1.03 d−1; Lahtvee et al., 2017) and 5,028 values of mammal cells (fibroblast cells yellow, median 0.347 d−1; Schwanhäusser et al., 2011). All rate constant values were log10-scaled.

Similar articles

Cited by

References

    1. Anders S, Pyl PT, Huber W (2015) HTSeq—a Python framework to work with high-throughput sequencing data. Bioinformatics 31: 166–169 - PMC - PubMed
    1. Andrews S. (2010). FastQC: A quality control tool for high throughput sequence data. http://www.bioinformatics.babraham.ac.uk/projects/fastqc (January 1, 2010)
    1. Barrett T, Wilhite SE, Ledoux P, Evangelista C, Kim IF, Tomashevsky M, Marshall KA, Phillippy KH, Sherman PM, Holko M, et al. (2013) NCBI GEO: Archive for functional genomics data sets—update. Nucleic Acids Res 41: D991–D995 - PMC - PubMed
    1. Beauvoit BP, Colombié S, Monier A, Andrieu M-H, Biais B, Bénard C, Chéniclet C, Dieuaide-Noubhani M, Nazaret C, Mazat J-P, et al. (2014) Model-assisted analysis of sugar metabolism throughout tomato fruit development reveals enzyme and carrier properties in relation to vacuole expansion. Plant Cell 26: 3224–3242 - PMC - PubMed
    1. Beauvoit B, Belouah I, Bertin N, Cakpo CB, Colombié S, Dai Z, Gautier H, Génard M, Moing A, Roch L, et al. (2018) Putting primary metabolism into perspective to obtain better fruits. Ann Bot 122: 1–21 - PMC - PubMed

Publication types