Small Molecules Target the Interaction between Tissue Transglutaminase and Fibronectin
- PMID: 31015308
- PMCID: PMC6548576
- DOI: 10.1158/1535-7163.MCT-18-1148
Small Molecules Target the Interaction between Tissue Transglutaminase and Fibronectin
Abstract
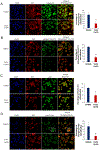
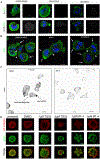
Tissue transglutaminase (TG2) is a multifunctional protein with enzymatic, GTP-ase, and scaffold properties. TG2 interacts with fibronectin (FN) through its N-terminus domain, stabilizing integrin complexes, which regulate cell adhesion to the matrix. Through this mechanism, TG2 participates in key steps involved in metastasis in ovarian and other cancers. High-throughput screening identified several small molecule inhibitors (SMI) for the TG2/FN complex. Rational medicinal chemistry optimization of the hit compound (TG53) led to second-generation analogues (MT1-6). ELISA demonstrated that these analogues blocked TG2/FN interaction, and bio-layer interferometry (BLI) showed that the SMIs bound to TG2. The compounds also potently inhibited cancer cell adhesion to FN and decreased outside-in signaling mediated through the focal adhesion kinase. Blockade of TG2/FN interaction by the small molecules caused membrane ruffling, delaying the formation of stable focal contacts and mature adhesions points and disrupted organization of the actin cytoskeleton. In an in vivo model measuring intraperitoneal dissemination, MT4 and MT6 inhibited the adhesion of ovarian cancer cells to the peritoneum. Pretreatment with MT4 also sensitized ovarian cancer cells to paclitaxel. The data support continued optimization of the new class of SMIs that block the TG2/FN complex at the interface between cancer cells and the tumor niche.
©2019 American Association for Cancer Research.
Conflict of interest statement
Figures


Similar articles
-
Small molecule inhibitors target the tissue transglutaminase and fibronectin interaction.PLoS One. 2014 Feb 20;9(2):e89285. doi: 10.1371/journal.pone.0089285. eCollection 2014. PLoS One. 2014. PMID: 24586660 Free PMC article.
-
Tissue Tranglutaminase Regulates Interactions between Ovarian Cancer Stem Cells and the Tumor Niche.Cancer Res. 2018 Jun 1;78(11):2990-3001. doi: 10.1158/0008-5472.CAN-17-2319. Epub 2018 Mar 6. Cancer Res. 2018. PMID: 29510995 Free PMC article.
-
RGD-independent cell adhesion via a tissue transglutaminase-fibronectin matrix promotes fibronectin fibril deposition and requires syndecan-4/2 α5β1 integrin co-signaling.J Biol Chem. 2010 Dec 17;285(51):40212-29. doi: 10.1074/jbc.M110.123703. Epub 2010 Oct 7. J Biol Chem. 2010. PMID: 20929862 Free PMC article.
-
Tissue transglutaminase-mediated chemoresistance in cancer cells.Drug Resist Updat. 2007 Aug-Oct;10(4-5):144-51. doi: 10.1016/j.drup.2007.06.002. Epub 2007 Jul 27. Drug Resist Updat. 2007. PMID: 17662645 Review.
-
Physiological, pathological, and structural implications of non-enzymatic protein-protein interactions of the multifunctional human transglutaminase 2.Cell Mol Life Sci. 2015 Aug;72(16):3009-35. doi: 10.1007/s00018-015-1909-z. Epub 2015 May 6. Cell Mol Life Sci. 2015. PMID: 25943306 Free PMC article. Review.
Cited by
-
A Combination of RNA-Seq Analysis and Use of TCGA Database for Determining the Molecular Mechanism and Identifying Potential Drugs for GJB1 in Ovarian Cancer.Onco Targets Ther. 2021 Apr 14;14:2623-2633. doi: 10.2147/OTT.S303589. eCollection 2021. Onco Targets Ther. 2021. PMID: 33883906 Free PMC article.
-
Shaping Oncogenic Microenvironments: Contribution of Fibronectin.Front Cell Dev Biol. 2024 Apr 10;12:1363004. doi: 10.3389/fcell.2024.1363004. eCollection 2024. Front Cell Dev Biol. 2024. PMID: 38660622 Free PMC article. Review.
-
LRP-1 links post-translational modifications to efficient presentation of celiac disease-specific T cell antigens.Cell Chem Biol. 2023 Jan 19;30(1):55-68.e10. doi: 10.1016/j.chembiol.2022.12.002. Epub 2023 Jan 5. Cell Chem Biol. 2023. PMID: 36608691 Free PMC article.
-
Sulfated glycosaminoglycans inhibit transglutaminase 2 by stabilizing its closed conformation.Sci Rep. 2022 Aug 3;12(1):13326. doi: 10.1038/s41598-022-17113-2. Sci Rep. 2022. PMID: 35922533 Free PMC article.
-
The Outside-In Journey of Tissue Transglutaminase in Cancer.Cells. 2022 May 29;11(11):1779. doi: 10.3390/cells11111779. Cells. 2022. PMID: 35681474 Free PMC article. Review.
References
-
- Naora H, Montell DJ. Ovarian cancer metastasis: integrating insights from disparate model organisms. Nat Rev Cancer. 2005;5(5):355–66. - PubMed
-
- Satpathy M, Cao L, Pincheira R, Emerson R, Bigsby R, Nakshatri H, et al. Enhanced peritoneal ovarian tumor dissemination by tissue transglutaminase. Cancer Res. 2007;67(15):7194–202. - PubMed
-
- Shao M, Cao L, Shen C, Satpathy M, Chelladurai B, Bigsby RM, et al. Epithelial-to-mesenchymal transition and ovarian tumor progression induced by tissue transglutaminase. Cancer Res. 2009;69(24):9192–201. - PubMed
Publication types
MeSH terms
Substances
Grants and funding
LinkOut - more resources
Full Text Sources
Medical
Miscellaneous

