. 2019 Jun;9(6):722-737.
doi: 10.1158/2159-8290.CD-18-1218. Epub 2019 Apr 23.

PARP Inhibitor Efficacy Depends on CD8+ T-cell Recruitment via Intratumoral STING Pathway Activation in BRCA-Deficient Models of Triple-Negative Breast Cancer

Affiliations

PARP Inhibitor Efficacy Depends on CD8+ T-cell Recruitment via Intratumoral STING Pathway Activation in BRCA-Deficient Models of Triple-Negative Breast Cancer

Constantia Pantelidou et al. Cancer Discov. 2019 Jun.

Abstract

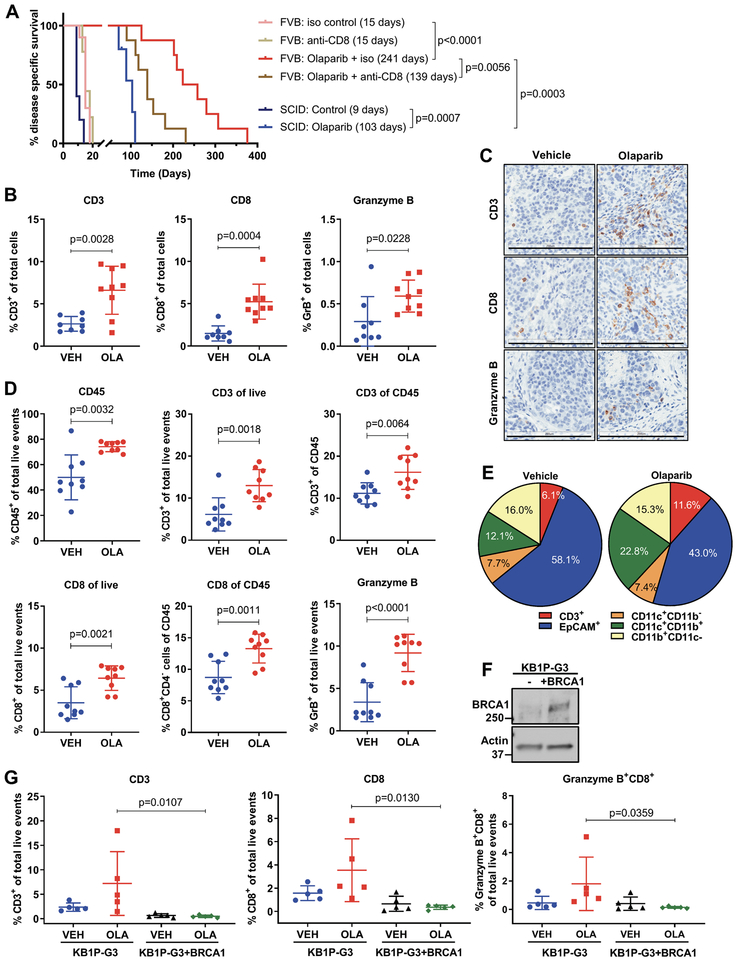
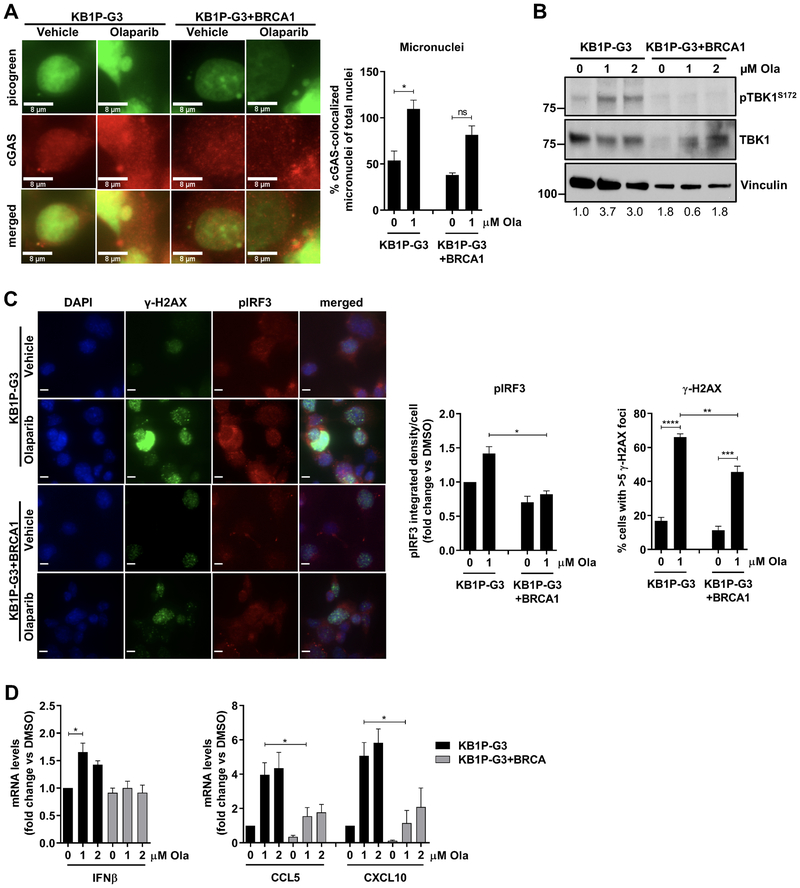
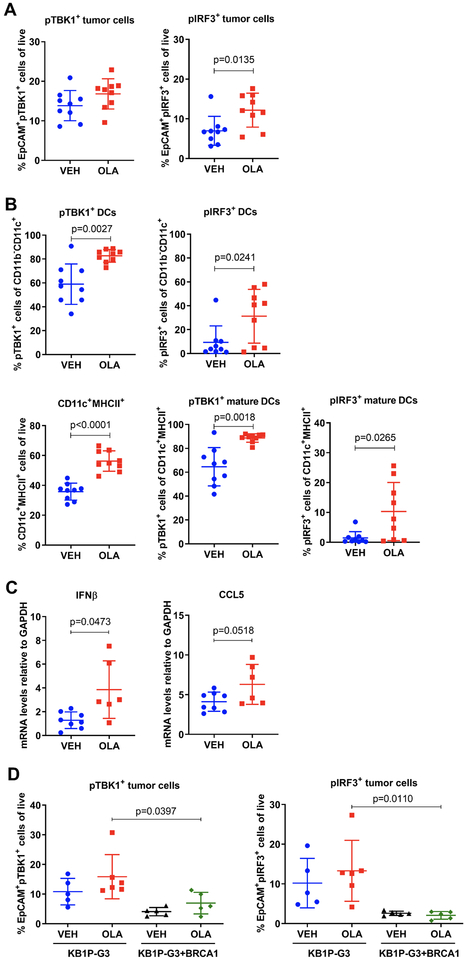
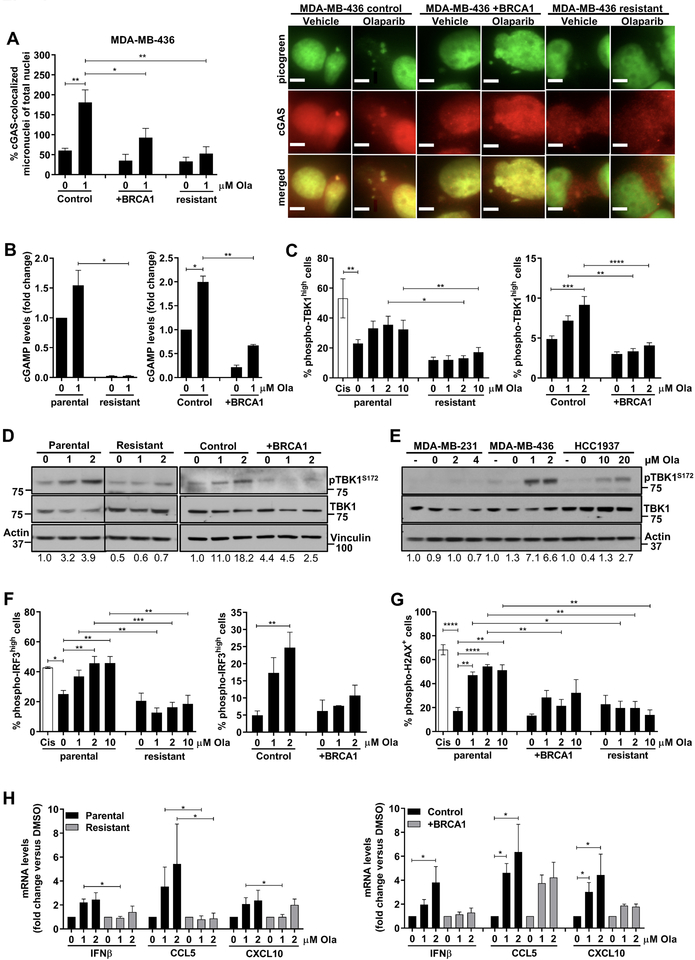
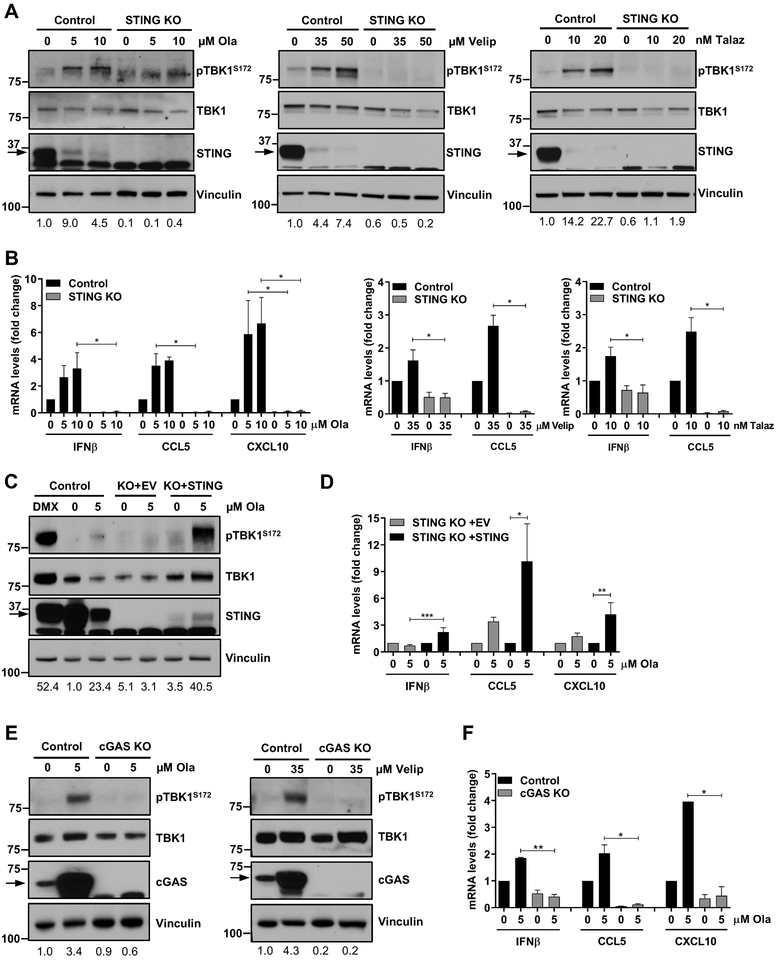
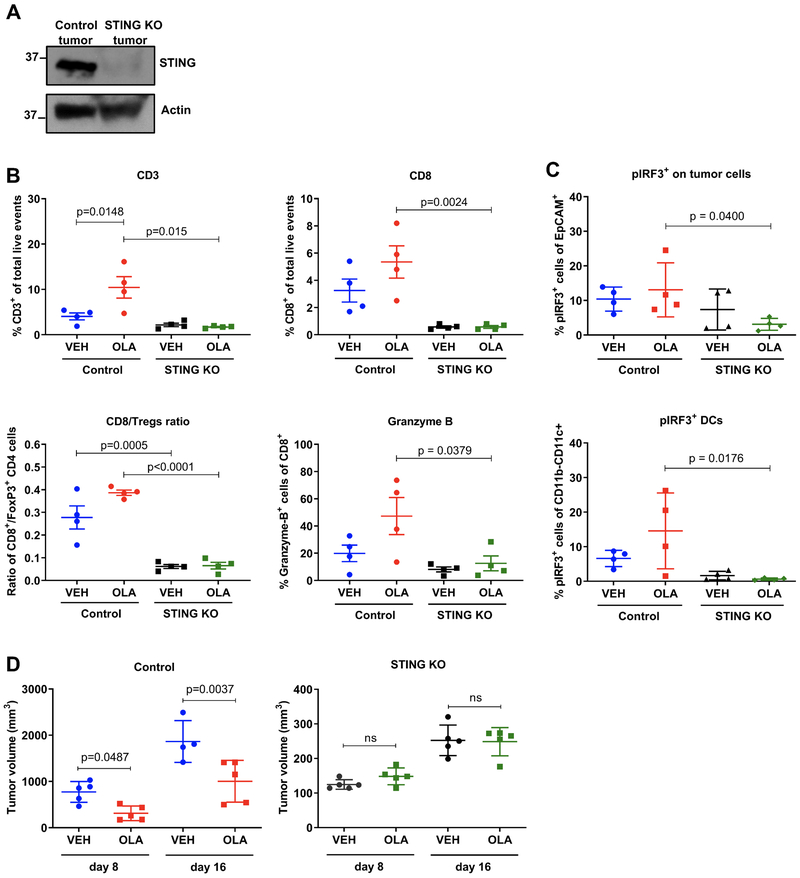
Combinatorial clinical trials of PARP inhibitors with immunotherapies are ongoing, yet the immunomodulatory effects of PARP inhibition have been incompletely studied. Here, we sought to dissect the mechanisms underlying PARP inhibitor-induced changes in the tumor microenvironment of BRCA1-deficient triple-negative breast cancer (TNBC). We demonstrate that the PARP inhibitor olaparib induces CD8+ T-cell infiltration and activation in vivo, and that CD8+ T-cell depletion severely compromises antitumor efficacy. Olaparib-induced T-cell recruitment is mediated through activation of the cGAS/STING pathway in tumor cells with paracrine activation of dendritic cells and is more pronounced in HR-deficient compared with HR-proficient TNBC cells and in vivo models. CRISPR-mediated knockout of STING in cancer cells prevents proinflammatory signaling and is sufficient to abolish olaparib-induced T-cell infiltration in vivo. These findings elucidate an additional mechanism of action of PARP inhibitors and provide a rationale for combining PARP inhibition with immunotherapies for the treatment of TNBC. SIGNIFICANCE: This work demonstrates cross-talk between PARP inhibition and the tumor microenvironment related to STING/TBK1/IRF3 pathway activation in cancer cells that governs CD8+ T-cell recruitment and antitumor efficacy. The data provide insight into the mechanism of action of PARP inhibitors in BRCA-associated breast cancer.This article is highlighted in the In This Issue feature, p. 681.


Figures

Figure 1.
Figure 1.. Efficacy of PARP inhibition depends on recruitment of CD8+ T cells.
(A) Tumor chunks from the BRCA GEMM were transplanted in syngeneic FVB/129P mice (8–10/group), which were treated with vehicle or olaparib along with an isotype (iso) control or an anti-CD8 antibody. Median survivals are shown in parentheses. Tumors were also transplanted in SCID mice (5–6/group) and treated with vehicle or olaparib. Statistical analysis was performed using the Log-rank (Mantel-Cox) test. (B-C) Vehicle (VEH) and olaparib (OLA)-treated tumors were harvested 5 days post-treatment, fixed and subjected to immunohistochemical analysis for CD3, CD8 and granzyme B expression. Staining was quantified using Aperio algorithms. Error bars represent standard deviation (SD). Statistical analyses were performed using unpaired t-tests or unpaired t-tests with Welch’s correction if variances were significantly different. Representative images are shown at 20X magnification. Scale Bar, 200 μm. (D-E) Tumors from vehicle or olaparib-treated mice (n=9) were harvested 5 days post-treatment and analyzed by flow cytometry. Scatter plots show significant increases in CD45+, CD3+, CD8+ and granzyme B+ cells in olaparib-treated animals. Pie charts show the proportions of different cell types (as % of total live events) in the tumor microenvironment. Error bars represent SD. Statistical analyses were performed using unpaired t-tests or unpaired t-tests with Welch’s correction. (F) Immunoblotting for BRCA1 expression in KB1P-G3 and KB1P-G3+BRCA1 cells. (G) KB1P-G3 and KB1P-G3+BRCA1 tumors from 5 vehicle- or olaparib-treated mice were harvested 5 days post-treatment and analyzed by flow cytometry. Scatter plots show % CD3+, CD8+ and granzyme B+ cells. Error bars represent SD. Statistical analyses were performed using two-way ANOVA with Sidak’s post-hoc test.
Figure 2.
Figure 2.. Olaparib activates the cGAS/STING pathway in cells derived from the K14-Cre-Brca1f/fTp53f/f GEMM.
The murine isogenic cell line pair KB1P-G3−/+BRCA1 derived from the GEMM was treated with DMSO (0 μM Olaparib) or the indicated doses of olaparib. (A) At 72h post-treatment, cells were stained with picogreen, fixed and subjected to immunofluorescence for cGAS. (Left panel). Representative images of picogreen- (green) and cGAS (red)-stained micronuclei are shown (60x magnification). Scale bar, 8 μm. (Right panel). The number of cGAS-colocalized micronuclei was quantified and expressed as % of total nuclei. Error bars represent standard error of the mean (SEM) of 2 independent experiments. Statistical analysis was performed using two-way ANOVA with Tukey’s post-hoc test. (B) At 72h post-treatment, cells were subjected to immunoblotting for phosphorylated (pTBK1Ser172) and total TBK1 expression with vinculin as a loading control. Markers indicate molecular weight (MW) (kDa). Numbers below the blots represent normalized pTBK1 protein levels quantified by densitometric analysis. (C) At 24h post-treatment, cells were fixed and subjected to immunofluorescence for γ-H2AX (pH2AX Ser139) and pIRF3Ser396. (Left panel) Representative images of DAPI- (blue), γ-H2AX- (green) and pIRF3 (red)- stained cells are shown (20x magnification); scale bar, 8 μm. (Right panels). pIRF3 corrected integrated density/cell was expressed as fold change versus KB1P-G3 DMSO. Statistical analysis was performed using Kruskal-Wallis test with Dunn’s post-hoc test. Error bars represent SEM of 3 independent experiments. The number of cells displaying >5 γ-H2AX foci was quantified, and statistical analysis was performed using two-way ANOVA with Tukey’s post-hoc test. (D) At 72h post-treatment, RNA was extracted and qPCR was performed. IFNβ, CCL5 and CXCL10 mRNA levels were normalized to GAPDH internal control. Error bars represent SEM of 3–4 independent experiments. Statistical analysis was performed using Kruskal-Wallis test with Dunn’s post-hoc test.
Figure 3.
Figure 3.. Olaparib induces pTBK1/pIRF3 signaling in tumor and dendritic cells from the K14-Cre-Brca1f/fTp53f/f GEMM of TNBC.
(A-B) Tumors from 9 vehicle- or olaparib-treated mice were harvested 5 days post-treatment and subjected to flow cytometry for analysis of pTBK1 and pIRF3 expression. Scatter plots demonstrate increases in (A) pTBK1+ and pIRF3+ epithelial (EpCAM+) cells, (B) DCs (CD11bCD11c+) and mature (CD11c+MHCII+) DCs in olaparib-treated animals. Error bars represent SD. Statistical analyses were performed using unpaired t-tests or unpaired t-tests with Welch’s correction. (C) Tumors from 9 vehicle- or olaparib-treated mice were harvested at 5 days and analyzed for mRNA expression of IFNβ and CCL5 by qPCR. Error bars represent SD. Statistical analyses were performed using an unpaired t-test with Welch’s correction (left panel) or an unpaired t-test (right panel). (D) KB1P-G3 and KB1P-G3+BRCA1 tumors from 5–6 vehicle or olaparib-treated mice were harvested at 5 days post-treatment and subjected to flow cytometry. Scatter plots demonstrate % pTBK1+ and pIRF3+ epithelial (EpCAM+) cells. Error bars represent SD. Statistical analyses were performed using two-way ANOVA with Tukey’s post-hoc test.
Figure 4.
Figure 4.. Olaparib activates the STING pathway more potently in HR-deficient TNBC cells compared to HR-proficient cells.
(A) The human TNBC isogenic cell line pair MDA-MB-436 control and BRCA1-reconstituted (+BRCA1) and a PARP inhibitor-resistant MDA-MB-436 clone were treated with DMSO (0 μM olaparib) or the indicated doses of olaparib for 72h and subjected to immunofluorescence with picogreen dye and anti-cGAS antibody. (Left panel) Quantification of micronuclei. Error bars represent SEM of 3 independent experiments. Statistical analysis was performed using one-way ANOVA with Sidak’s post-hoc test. (Right panel) Representative images of picogreen (green) and cGAS (red) stained micronuclei are shown (60x magnification). Scale bar, 8 μm; (B) At 72h post-treatment with DMSO or olaparib, lysates from parental and PARP inhibitor-resistant MDA-MB-436 cells, as well as MDA-MB-436 control and BRCA1-reconstituted cells (+BRCA1) were subjected to ELISA for cGAMP production. cGAMP levels were expressed as fold-change versus DMSO. Error bars represent SEM of 2 independent experiments. Statistical analysis was performed using Kruskal-Wallis test with Dunn’s post-hoc test; (C) The same cell lines were treated as in (B) and subjected to flow cytometric analysis of pTBK1Ser172 expression. Cisplatin (Cis; 1 μM) was used as positive control. Error bars represent SEM of 2–4 independent experiments. Statistical analysis was performed using one-way ANOVA with Sidak’s post-hoc test (left panel) or two-way ANOVA with Tukey’s post-hoc (right panel); (D) Cell lines were treated with DMSO or the indicated concentrations of olaparib for 72h and lysates were subjected to immunoblotting for pTBK1Ser172 and total TBK1 expression. Vertical black lines indicate points of blot cropping. (E) MDA-MB-436, HCC1937 and MDA-MB-231 human TNBC cell lines were treated with olaparib according to their 7-day IC50 values and subjected to immunoblotting for pTBK1Ser172 and total TBK1 expression. (F-G) Parental, PARP inhibitor-resistant, control and BRCA1-reconstituted MDA-MB-436 cells were subjected to flow cytometric analysis for pIRF3Ser396 and pH2AXSer139 expression. Cisplatin (Cis; 1 μM) was used as a positive control. Error bars represent SEM of 2–4 independent experiments. Statistical analysis was performed using one-way ANOVA with Sidak’s post-hoc test or two-way ANOVA with Tukey’s post-hoc. (H) qPCR analysis of IFNβ, CCL5 and CXCL10 mRNA levels in parental, PARP inhibitor-resistant, control and BRCA1-reconstituted MDA-MB-436 cells, normalized to GAPDH internal control. Error bars represent SEM of 4 independent experiments. Statistical analyses were performed using Kruskal-Wallis test Dunn’s post-hoc test.
Figure 5.
Figure 5.. STING or cGAS depletion abolishes olaparib-induced proinflammatory signaling.
(A-B) Murine K14 CRISPR/Cas9 control or STING knockout (STING KO) cells were treated with DMSO (0 μM) or the indicated doses of olaparib, veliparib or talazoparib for 72h and subjected to immunoblotting or qPCR. STING depletion, as shown by immunoblotting for total STING levels, abolishes PARP inhibitor-induced TBK1 phosphorylation and upregulation of IFNβ, CCL5 and CXCL10 mRNA levels, as measured by immunoblotting and qPCR, respectively. Arrows on the blots indicate specific bands and markers indicate MW (kDa). Error bars represent SEM of 3 independent experiments. Statistical analyses were performed using Kruskal-Wallis test with Dunn’s post-hoc test. (C-D) K14 CRISPR/Cas9 control, STING KO with empty vector (KO+EV) or STING KO with STING-repletion (KO+STING) cells were treated with DMSO or olaparib for 72h and subjected to immunoblotting or qPCR. DMXAA (DMX; 10 μM) was used as a positive control. STING repletion in KO cells, as shown by immunoblotting for total STING levels, rescues olaparib-induced TBK1 phosphorylation and induction of IFNβ, CCL5 and CXCL10 mRNA expression. Error bars represent SEM of 3 independent experiments. Statistical analyses were performed using Kruskal-Wallis test with Dunn’s post-hoc test. (E-F) K14 CRISPR/Cas9 control or cGAS KO cells were treated with the indicated doses of olaparib or veliparib for 72h and subjected to immunoblotting or qPCR. cGAS depletion, as shown by immunoblotting for cGAS levels, abolishes PARP inhibitor-induced TBK1 phosphorylation and upregulation of IFNβ, CCL5 and CXCL10 mRNA levels, as measured by immunoblotting and qPCR, respectively. Error bars represent SEM of 3 independent experiments. Statistical analyses were performed using Kruskal-Wallis test with Dunn’s post-hoc test.
Figure 6.
Figure 6.. Intratumoral STING depletion abolishes olaparib-induced T cell recruitment and anti-tumor efficacy.
(A) Immunoblotting for total STING protein levels in K14 control or STING KO tumors. (B-C) Control and STING KO tumors from 4 mice treated with vehicle or olaparib for 5 days were subjected to flow cytometry. Scatter plots demonstrate increases in T cells (CD3+, CD8+ and granzyme B+) and pIRF3+ tumor (EpCAM+) and dendritic (CD11C+CD11B) cells in olaparib-treated control but not STING KO tumors. Error bars represent SD. Statistical analyses were performed using one-way ANOVA with Sidak’s post-hoc test. (D) K14 CRISPR/Cas9 control or STING KO tumors were transplanted in syngeneic FVB/129P2 mice (5/group), which were treated with vehicle or olaparib. Tumor volumes (mm3) were measured at days 8 and 16. Error bars represent SD. Statistical analysis was performed using one-way ANOVA with Sidak’s post-hoc test.

References

    1. Carey L, Winer E, Viale G, Cameron D, Gianni L. Triple-negative breast cancer: disease entity or title of convenience? Nat Rev Clin Oncol 2010;7:683–92. - PubMed
    1. Bianchini G, Balko JM, Mayer IA, Sanders ME, Gianni L. Triple-negative breast cancer: challenges and opportunities of a heterogeneous disease. Nat Rev Clin Oncol 2016;13:674–90. - PMC - PubMed
    1. Lord CJ, Ashworth A. PARP inhibitors: Synthetic lethality in the clinic. Science 2017;355:1152–8. - PMC - PubMed
    1. Robson M, Im S-A, Senkus E, Xu B, mchek S, Masuda N, et al. Olaparib for Metastatic Breast Cancer in Patients with a Germline BRCA Mutation. New Engl J Med 2017;377:523–33. - PubMed
    1. Litton JK, Rugo HS, Ettl J, Hurvitz SA, Gonçalves A, Lee K-HH, et al. Talazoparib in Patients with Advanced Breast Cancer and a Germline BRCA Mutation. New Engl J Med 2018;379:753–63. - PMC - PubMed

Publication types

MeSH terms