. 2019 Jun 26;39(26):5115-5127.
doi: 10.1523/JNEUROSCI.0076-19.2019. Epub 2019 Apr 23.

Contribution of Sensory Encoding to Measured Bias

Affiliations

Contribution of Sensory Encoding to Measured Bias

Miaomiao Jin et al. J Neurosci. .

Abstract

Signal detection theory (SDT) is a widely used theoretical framework that describes how variable sensory signals are integrated with a decision criterion to support perceptual decision-making. SDT provides two key measurements: sensitivity (d') and bias (c), which reflect the separability of decision variable distributions (signal and noise) and the position of the decision criterion relative to optimal, respectively. Although changes in the subject's decision criterion can be reflected in changes in bias, decision criterion placement is not the sole contributor to measured bias. Indeed, neuronal representations of bias have been observed in sensory areas, suggesting that some changes in bias are because of effects on sensory encoding. To directly test whether the sensory encoding process can influence bias, we optogenetically manipulated neuronal excitability in primary visual cortex (V1) in mice of both sexes during either an orientation discrimination or a contrast detection task. Increasing excitability in V1 significantly decreased behavioral bias, whereas decreasing excitability had the opposite effect. To determine whether this change in bias is consistent with effects on sensory encoding, we made extracellular recordings from V1 neurons in passively viewing mice. Indeed, we found that optogenetic manipulation of excitability shifted the neuronal bias in the same direction as the behavioral bias. Moreover, manipulating the quality of V1 encoding by changing stimulus contrast or interstimulus interval also resulted in consistent changes in both behavioral and neuronal bias. Thus, changes in sensory encoding are sufficient to drive changes in bias measured using SDT.SIGNIFICANCE STATEMENT Perceptual decision-making involves sensory integration followed by application of a cognitive criterion. Using signal detection theory, one can extract features of the underlying decision variables and rule: sensitivity (d') and bias (c). Because bias is measured as the difference between the optimal and actual criterion, it is sensitive to both the sensory encoding processes and the placement of the decision criterion. Here, we use behavioral and electrophysiological approaches to demonstrate that measures of bias depend on sensory processes. Optogenetic manipulations of V1 in mice bidirectionally affect both behavioral and neuronal measures of bias with little effect on sensitivity. Thus, changes in sensory encoding influence bias, and the absence of changes in sensitivity do not preclude changes in sensory encoding.

Keywords: contrast; mouse visual cortex; optogenetics; orientation; psychophysics; signal detection theory.


Figures

Figure 1.
Figure 1.
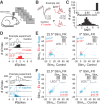
Optogenetically suppressing or exciting V1 decreases or increases hit and FA rates in an orientation discrimination task. A, Schematic of effect of shifting signal and noise distributions on bias measured using signal detection theory. Top, Distributions of target (22.5°; solid black, signal) and distractor (0°; solid gray, noise) responses. Note that bias (c) is measured as the distance between the actual (black vertical line) and optimal (c = 0; gray vertical line) criterion. Bottom, Manipulations that decrease both the target and distractor distributions shift the optimal criterion to the left, and therefore result in an increase in bias. Purple lines indicate the measured sensitivity (d′) that is the distance between the mean of target and distractor distributions. B, Schematic of behavior setup and trial progression. Blue light is turned on for a single target or distractor presentation on each trial. V1 suppression (blue) and excitation (red) is achieved via optogenetically driving PV+ or VGAT+ neurons and Emx1+ neurons respectively. C, Schematic of perceptual choice circuit for the orientation discrimination task. Orientation tuned excitatory neurons (shades of gray) converge onto the decoder with weights biased toward target-preferring neurons (modified from Jin et al., 2019). D, Cumulative release rate [as fraction of all targets (black) or distractor (gray) presentations] as a function of reaction times relative to the onset of target or distractor stimulus for an example mouse in the control condition. Vertical lines represent the react window used to calculate both hit and FA rate. E, Hit rate and FA rate (inset) for control (black) and V1 suppression (blue; left) or excitation (red; right) for one example mouse each. Note that the example mouse for V1 suppression is the same as in D. Hit rates are fit with a Weibull function; vertical dotted lines are threshold, error is 95% confidence interval.
Figure 2.
Figure 2.
Optogenetically suppressing or exciting V1 decreases or increases neuronal responses to both targets and distractors. A, Schematic of extracellular recording setup. Stimuli are presented as in Figure 1B to passively viewing mice. B, Left, Mean waveform shapes for control and V1 excitation for and an example cell. Shaded area is SD across spikes. Right, Same cell's responses to 22.5° target (top) and 0° distractor (bottom) for control (black) and V1 excitation (red). Black horizontal bar is the duration of the visual presentation and red horizontal bar is the duration of light delivery for exciting V1. Shaded area is SEM across trials. C, Top, Histogram of the correlation coefficient of waveform shapes between control and V1 suppression/excitation. Bottom, Signal-to-noise ratio (SNR; mean/SD) of the trough value of the waveform across all the cells (n = 153 cells, including V1 suppression and excitation). D, Distributions of spikes summed across a simultaneously recorded populations in response to distractor (0°; open bars) and target (22.5°; filled bars) stimuli on control trials (black) and during V1 excitation (red; n = 16 cells; top) or suppression (blue; n = 17 cells; bottom) for one example experiment each. Triangles show the mean of the distribution. E, Comparison of neuronal responses (FR, in hertz) to the 22.5° target (left) and 0° distractor (right) between control and V1 excitation (red)/suppression (blue) on the current stimulus (StimN). Filled circles are individual cells and error bars are SEM across cells with white dots in the center showing the mean of the population (excitation: n = 83 cells, 3 mice; suppression: n = 70 cells, 3 mice). F, Comparison of neuronal responses (FR, in hertz) to the 22.5° target (left) and 0° distractor (right) on StimN when the previous stimulus (StimN−1) was excited/suppressed versus control.
Figure 3.
Figure 3.
Suppressing or exciting V1 increases or decreases behavioral bias. A, Schematic of behavior setup and trial progression. StimN is the stimulus that the animal responded to by releasing the lever and StimN−1 is the stimulus preceding StimN. V1 suppression (blue) and excitation (red) is achieved via optogenetically driving PV+ or VGAT+ neurons and Emx1+ neurons, respectively. B, Comparison of the hit (22.5°; left) and FA rate (0°; right) between control and V1 suppression (blue; n = 4 mice) or excitation (red; n = 4 mice) on StimN. Filled circles are individual mice and error bars are SEM across mice with white dots in the center showing the mean of the population. C, Same as B, for bias (left) and sensitivity (right) at 22.5°. D, Same as C, for V1 suppression or excitation on StimN−1.
Figure 4.
Figure 4.
Suppressing or exciting V1 increases or decreases neuronal bias. A, Left, Schematic of extracellular recording setup. Right, For V1 suppression, the criterion (solid red line) is set as the mean of each cell's responses to the maximum and minimum response conditions. In the case of optogenetic suppression, this is the mean of the 22.5° targets in the control condition (black) and the suppressed 0° distractors (light blue). B, Predicted hit (22.5°; left) and FA rate (0°; right) from neuronal responses using a fixed criterion for each cell (see Materials and Methods). Error is SEM across cells (V1 suppression-blue: n = 47 cells, 3 mice; V1 excitation-red, n = 45 cells, 3 mice). C, Predicted bias (left) and sensitivity (right) using the predicted hit and FA rate in B.
Figure 5.
Figure 5.
Suppressing V1 increases behavioral bias in a contrast detection task. A, Schematic of behavior setup and trial progression for a contrast detection task. Blue light is turned on during the entire length of a trial. V1 suppression (blue) is achieved via optogenetically driving PV+ or VGAT+ neurons. B, Hit rate (left) and FA rate (right) for control (black) and V1 suppression (blue) for one example mouse. Hit rates are fitted with a Weibull function; vertical dotted lines are threshold, error is 95% confidence interval. C, Comparison of the hit (10% contrast; left) and FA rate (0% contrast; right) between control and V1 suppression (blue; n = 4 mice). Filled circles are individual mice and error bars are SEM across mice with white dots in the center showing the mean of the population. D, Same as C, for bias (left) and sensitivity (right) at 10% contrast.
Figure 6.
Figure 6.
Decreasing stimulus contrast decreases both hit and FA rate and increases behavioral and neuronal bias in the orientation discrimination task. A, Left, Schematic of behavioral setup. Stimulus contrast is varied [30% (light gray), 50% (dark gray), or 70% (black)] on each stimulus presentation. Right, Hit rate and FA rate (inset) for each contrast for an example mouse. Hit rates are fit with a Weibull function; vertical dotted lines are threshold, error is 95% confidence interval. B, Left, Schematic of extracellular recording setup. Right, Comparison of neuronal responses (FR, in hertz) to the 22.5° target (black) and 0° distractor (green) between 30 and 70% contrast. Filled circles are individual cells and error bars are SEM across cells with white dots in the center showing the mean of the population (n = 92 cells, 4 mice). C, Comparison of behavioral hit (left; 22.5° target) and FA rate (right; 0° distractor) between two contrasts (70 vs 30%). Filled circles are individual mice and error bars are SEM across mice with white dots in the center showing the mean of the population (n = 5). D, Same as C, for bias (left) and sensitivity (right) at 22.5°. E, F, Same as C and D, for predicted (E) hit and FA rate and (F) bias and sensitivity from the neuronal data (n = 19 cells, 4 mice).
Figure 7.
Figure 7.
Adaptation decreases both hit and FA rate and increases behavioral and neuronal bias in the orientation discrimination task. A, Left, Schematic of behavioral setup. ISI is varied [250 ms (light gray), 500 ms (dark gray) or 750 ms (black)] on each stimulus presentation. Right, Hit rate and FA rate (inset) for each ISI for an example mouse. Hit rates are fit with a Weibull function; vertical dotted lines are threshold, error is 95% confidence interval. B, Left, Schematic of extracellular recording setup. Right, Comparison of neuronal responses (FR, in hertz) to the 22.5° target (black), and 0° distractor (green) after 750 or 250 ms ISIs. Filled circles are individual cells and error bars are SEM across cells with white dots in the center showing the mean of the population (n = 74 cells, 4 mice). C, Comparison of behavioral hit (left; 22.5° target) and FA rate (right; 0° distractor) between two ISIs (750 vs 250 ms). Filled circles are individual mice and error bars are SEM across mice with white dots in the center showing the mean of the population (n = 11). D, Same as C, for bias (left) and sensitivity (right) at 22.5°. E, F, Same as C and D, for predicted (E) hit and FA rate and (F) bias and sensitivity from the neuronal data (n = 21 cells, 4 mice).

Similar articles

Cited by

References

    1. Bang JW, Rahnev D (2017) Stimulus expectation alters decision criterion but not sensory signal in perceptual decision making. Sci Rep 7:17072. 10.1038/s41598-017-16885-2 - DOI - PMC - PubMed
    1. Bashinski HS, Bacharach VR (1980) Enhancement of perceptual sensitivity as the result of selectively attending to spatial locations. Percept Psychophys 28:241–248. 10.3758/BF03204380 - DOI - PubMed
    1. Bennett C, Arroyo S, Hestrin S (2013) Subthreshold mechanisms underlying state-dependent modulation of visual responses. Neuron 80:350–357. 10.1016/j.neuron.2013.08.007 - DOI - PMC - PubMed
    1. Carandini M, Churchland AK (2013) Probing perceptual decisions in rodents. Nat Neurosci 16:824–831. 10.1038/nn.3410 - DOI - PMC - PubMed
    1. Clifford CW, Webster MA, Stanley GB, Stocker AA, Kohn A, Sharpee TO, Schwartz O (2007) Visual adaptation: neural, psychological and computational aspects. Vision Res 47:3125–3131. 10.1016/j.visres.2007.08.023 - DOI - PubMed

Publication types

LinkOut - more resources