. 2019 Apr 23;10(1):1878.
doi: 10.1038/s41467-019-09643-7.

TORC1 modulation in adipose tissue is required for organismal adaptation to hypoxia in Drosophila

Affiliations

TORC1 modulation in adipose tissue is required for organismal adaptation to hypoxia in Drosophila

Byoungchun Lee et al. Nat Commun. .

Abstract

Animals often develop in environments where conditions such as food, oxygen and temperature fluctuate. The ability to adapt their metabolism to these fluctuations is important for normal development and viability. In most animals, low oxygen (hypoxia) is deleterious. However some animals can alter their physiology to tolerate hypoxia. Here we show that TORC1 modulation in adipose tissue is required for organismal adaptation to hypoxia in Drosophila. We find that hypoxia rapidly suppresses TORC1 signaling in Drosophila larvae via TSC-mediated inhibition of Rheb. We show that this hypoxia-mediated inhibition of TORC1 specifically in the larval fat body is essential for viability. Moreover, we find that these effects of TORC1 inhibition on hypoxia tolerance are mediated through remodeling of fat body lipid storage. These studies identify the larval adipose tissue as a key hypoxia-sensing tissue that coordinates whole-body development and survival to changes in environmental oxygen by modulating TORC1 and lipid metabolism.


Conflict of interest statement

The authors declare no competing interests.

Figures
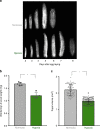
Fig. 1
Fig. 1
Hypoxia inhibits larval growth and development. a Larvae were hatched in normoxia and then either maintained in normoxia (top images) or transferred to hypoxia (5% oxygen, bottom images). Larvae and pupae were then subsequently imaged on each day following egg hatching. Hypoxia led to a delay in larval growth and development. b Larvae were hatched in normoxia and then maintained in either normoxia or hypoxia (5% oxygen) until the wandering third instar stage. Larval weights were then measured. Hypoxia led to a reduction in larval mass. Data are expressed as mean ± SEM. *p < 0.05, Students t-test. c Larvae were hatched in normoxia and then maintained in either normoxia or hypoxia (5% oxygen) until pupation. Pupal size was then measured. Hypoxia lead to a reduction final pupal size. Data are expressed as mean ± SEM, *p < 0.05, Students t-test
Fig. 2
Fig. 2
Hypoxia suppresses TORC1 signalling via TSC1/2. a Early third instar larvae were transferred from normoxia to hypoxia (5% oxygen). At the indicated times, larvae were then collected, lysed and processed for SDS-PAGE and western blotting using antibodies to phospho-S6K (pS6K) or total eIF2alpha (eIF2α). b Early third instar larvae were transferred from normoxia to different levels of hypoxia (20–1% oxygen) for 1 h. Larvae were then collected, lysed and processed for SDS-PAGE and western blotting using antibodies to phospho-S6K (pS6K) or total eIF2alpha (eIF2α). c Control (da>+) or Rheb overexpressing (da > Rheb) early third instar larvae were either maintained in normoxia (N) or transferred from normoxia to hypoxia (5% oxygen, H) for 1 h. Larvae were then collected, lysed and processed for SDS-PAGE and western blotting using antibodies to phospho-S6K (pS6K) or total eIF2alpha (eIF2α). Quantified band intensities from three independent experiments are shown below the blot. Data represent relative pS6K band intensities corrected for eIF2α (loading control) band intensity. Quantifications were performed using Image J. Data represent mean ± SD. *p < 0.05, Students t-test. d Control (w1118) or tsc1 mutant (tsc1W240X) larvae were either maintained in normoxia (N) or transferred from normoxia to hypoxia (5% oxygen, H) for 1 h. Larvae were then collected, lysed and processed for SDS-PAGE and western blotting using antibodies to phospho-S6K (pS6K) or total eIF2alpha (eIF2α). Quantified band intensities from three independent experiments are shown below the blot. Data represent relative pS6K band intensities corrected for eIF2α (loading control) band intensity. Quantifications were performed using Image J. Data represent mean ± SD. *p < 0.05, Students t-test. e Control (w1118) or sima mutant (sima07607) larvae were either maintained in normoxia (N) or transferred from normoxia to hypoxia (5% oxygen, H) for 1 h. Larvae were then collected, lysed and processed for SDS-PAGE and western blotting using antibodies to phospho-S6K (pS6K) or total S6K. f Control (w1118) or scylla mutant (scylla) larvae were either maintained in normoxia (N) or transferred from normoxia to hypoxia (5% oxygen, H) for 1 h. Larvae were then collected, lysed and processed for SDS-PAGE and western blotting using antibodies to phospho-S6K (pS6K) or total eIF2alpha (eIF2α)
Fig. 3
Fig. 3
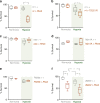
Suppression of TORC1 is required for adaptation to hypoxia. ad Control (da>+) or Rheb overexpressing (da > Rheb) animals were maintained in either normoxia or hypoxia (5% oxygen) throughout the larval period. a Survival to the pupal stage was measured by calculating the percentage or larvae that developed to pupae for each experimental condition. b The rate of larval development was measured by calculating the percentage of animals that progressed to the pupal stage over time. N = a minimum of four independent groups of animals (50/group). Maintaining TORC1 signalling in larvae during hypoxia led to a further delay in pupation. c Weights of wandering third instar larvae were measured for each experimental condition. Maintaining TORC1 signalling in hypoxia did not increase larval growth. Data are presented as box plots (25%, median and 75% values) with error bars indicating the min and max values. N = 5 groups of larvae per condition. d, e Control (da>+) or Rheb overexpressing (da > Rheb) animals were maintained in either normoxia or hypoxia (5% oxygen) throughout the larval period, before being returned to normoxia at the pupal stage. The percentage of animals that developed to d pharate adults, or e eclosed adults were then calculated. Maintaining TORC1 signalling in larvae during hypoxia led to a subsequent lethality during pupal development. Data are presented as box plots (25%, median and 75% values) with error bars indicating the min and max values. N = five independent groups of animals (50 animals per group) per experimental condition. *p < 0.05, Students t-test. f Control (da>+) or S6KTE overexpressing (da > S6KTE) animals were maintained in either normoxia or hypoxia (5% oxygen) throughout the larval period, before being returned to normoxia at the pupal stage. The percentage of animals that developed to adults was then calculated. Data are presented as box plots (25%, median and 75% values) with error bars indicating the min and max values. N = a minimum of four independent groups of animals (50 animals per group) per experimental condition. *p < 0.05, Students t-test
Fig. 4
Fig. 4
Suppression of TORC1 in the fat body is required for adaptation to hypoxia. a Control (r4>+) larvae or larvae overexpressing Rheb in the fat body (r4 > Rheb) were maintained in either normoxia or hypoxia (5% oxygen) throughout the larval period and then were returned to normoxia at the beginning of the pupal stage. The percentage of animals that survived to adults was then measured. Animals expressing Rheb in the fat body and exposed to hypoxia as larvae showed a significant decrease in adult survival. Data are presented as box plots (25%, median and 75% values) with error bars indicating the min and max values. N = a minimum of four groups (50 animals per group) per experimental condition. *p < 0.05, Students t-test. b Control larvae (r4>+) or larvae expressing an inverted repeat RNAi transgene to TSC2 (r4 > TSC2 IR) were maintained in hypoxia throughout the larval period from hatching to pupation. Animals were then returned to normoxia and the percentage of animals surviving to the adult stage counted. Data are presented as box plots (25%, median and 75% values) with error bars indicating the min and max values. N = 6 groups of animals (50 animals per group) per experimental condition. *p < 0.05, Students t-test. ce Rheb was overexpressed in larval neurons (c, elav > Rheb), the intestine (d, MyoIA > Rheb), the prothoracic gland (e, P0206 > Rheb) or muscle (f, dmef2 > Rheb). Animals were hatched in normoxia and then maintained throughout the larval period in either normoxic or hypoxic conditions, before being returned to normoxia at the pupal stage. The percentage of animals that survived to the adult stage was calculated for each experimental condition. Control animals carried the Gal4 transgene alone. Data are presented as box plots (25%, median and 75% values) with error bars indicating the min and max values. N = a minimum of four independent groups of animals (50 animals per group) per experimental condition. *p < 0.05, Students t-test
Fig. 5
Fig. 5
Hypoxia does not induce autophagy. Early third instar larvae were maintained in normoxia (left panels), transferred to hypoxia for 6 h (middle panels), or starved on PBS for 6 h (right panels). Fat bodies were then dissected, stained with LysoTracker and then imaged. Red = LysoTracker; blue = Hoechst DNA stain. Scale bar = 50μm. Starvation, but not hypoxia, induced autophagy in the fat body. For each condition, fat bodies were dissected from at least fifteen independent larvae. The images are representative lysotracker staining from each condition. We observed essentially no LysoTracker Red stained punctae in either the fed or hypoxic fat bodies, but all the starved fat bodies showed pronounced staining similar to that seen in the representative image in this figure
Fig. 6
Fig. 6
Hypoxia alters lipid levels and lipid storage. a Larvae were hatched in normoxia and then maintained throughout the larval period in either normoxic or hypoxic conditions. Fat bodies from third instar larvae were then imaged using DIC microscopy. Blue = Hoechst DNA stain. Hypoxia led to an increase in lipid droplet size in fat body cells. Scale bar = 50μm b w1118 larvae were grown in normoxia until 72 h after egg laying at which point they were transferred to one of four experimental conditions for 48 h: normoxia, hypoxia, sugar-only diet, complete starvation (PBS) diet. Fat bodies were then dissected, stained with Nile Red and then imaged. Red = Nile Red, blue = Hoechst DNA dye. c. Lipid droplet sizes from normoxic and hypoxic fat bodies represented in B were measured and presented as mean diameter ±SEM (*p < 0.05, Students t-test). d Larvae were hatched in normoxia and then maintained throughout the larval period in either normoxic or hypoxic conditions. Total TAG levels from third instar larvae from both experimental conditions were then measured. Data are presented as mean  ±SEM (*p < 0.05, Students t-test). e Larvae were hatched in normoxia and then maintained throughout the larval period in either normoxic or hypoxic conditions. Larval lipid content was then estimated in wandering third instar larvae using an assay, which measures the percentage of larvae that float in increasing amounts of a sucrose solution. N = 5 independent groups of larvae (50/group)
Fig. 7
Fig. 7
TORC1 suppression is required for hypoxia-induced modulation of lipid storage. The MARCM system was used to generate GFP-marked tsc1W240X mutant cell clones in the fat body. Hatched larvae were then either maintained in normoxia or transferred to hypoxia. At the third instar stage, larval fat bodies were fixed, dissected and mounted on coverslips. Fat bodies were then imaged using DIC microscopy to visualize lipid droplets. Blue = Hoechst DNA dye. Scale bar = 50μm
Fig. 8
Fig. 8
Reorganization of lipid droplets is required for adaptation to hypoxia. a Control larvae (r4>+) larvae expressing an RNAi transgene to Lsd2 (r4 > Lsd2 IR), or larvae expressing UAS-brummer (r4 > bmm) were exposed to hypoxia for 48 h of hypoxia and fat bodies were stained with Nile Red. Scale bar = 50μm. b Control larvae (r4>+) or larvae expressing an inverted repeat RNAi transgene to Lsd2 (r4 > Lsd2 IR) were maintained in hypoxia throughout the larval period from hatching to pupation. Animals were then returned to normoxia and the percentage of animals surviving to the adult stage was counted. N = 5 groups of animals (50 animals per group) per experimental condition. *p < 0.05, Students t-test. c Control (w1118) or lsd2 mutant (lsd2KG00149) larvae were maintained in hypoxia throughout the larval period from hatching to pupation. Animals were then returned to normoxia and the percentage of animals surviving to the adult stage counted. N = 4 independent groups of animals (50 animals per group) per experimental condition. *p < 0.05, Students t-test. d, e Control larvae (r4>+) or larvae expressing an inverted repeat RNAi transgene to either d ACC (r4 > ACC IR) or e lipin (r4 > lipin IR) were maintained in hypoxia throughout the larval period from hatching to pupation. Animals were then returned to normoxia and the percentage of animals surviving to the adult stage was counted. N = 4 independent groups of animals (50 animals per group) per experimental condition. *p < 0.05, Students t-test. f Control larvae (r4>+) or larvae expressing UAS-brummer (r4 > bmm) were maintained in hypoxia throughout the larval period from hatching to pupation. Animals were then returned to normoxia and the percentage of animals surviving to the adult stage counted. N = 6 independent groups of animals (50 animals per group) per experimental condition. *p < 0.05, Students t-test. For panels bf, the data are presented as box plots (25%, median and 75% values) with error bars indicating the min and max values

Similar articles

Cited by

References

    1. Hamdoun A, Epel D. Embryo stability and vulnerability in an always changing world. Proc. Natl Acad. Sci. USA. 2007;104:1745–1750. doi: 10.1073/pnas.0610108104. - DOI - PMC - PubMed
    1. Gilbert SF. Developmental plasticity and developmental symbiosis: the return of Eco-Devo. Curr. Top. Dev. Biol. 2016;116:415–433. doi: 10.1016/bs.ctdb.2015.12.006. - DOI - PubMed
    1. Semenza GL. Oxygen sensing, homeostasis, and disease. N. Engl. J. Med. 2011;365:537–547. doi: 10.1056/NEJMra1011165. - DOI - PubMed
    1. Bickler PE, Buck LT. Hypoxia tolerance in reptiles, amphibians, and fishes: life with variable oxygen availability. Annu. Rev. Physiol. 2007;69:145–170. doi: 10.1146/annurev.physiol.69.031905.162529. - DOI - PubMed
    1. Ramirez JM, Folkow LP, Blix AS. Hypoxia tolerance in mammals and birds: from the wilderness to the clinic. Annu. Rev. Physiol. 2007;69:113–143. doi: 10.1146/annurev.physiol.69.031905.163111. - DOI - PubMed

Publication types

MeSH terms

Substances

LinkOut - more resources