. 2019 Apr 23;10(1):1915.
doi: 10.1038/s41467-019-09672-2.

A chemical toolbox for the study of bromodomains and epigenetic signaling

Affiliations

A chemical toolbox for the study of bromodomains and epigenetic signaling

Qin Wu et al. Nat Commun. .

Abstract

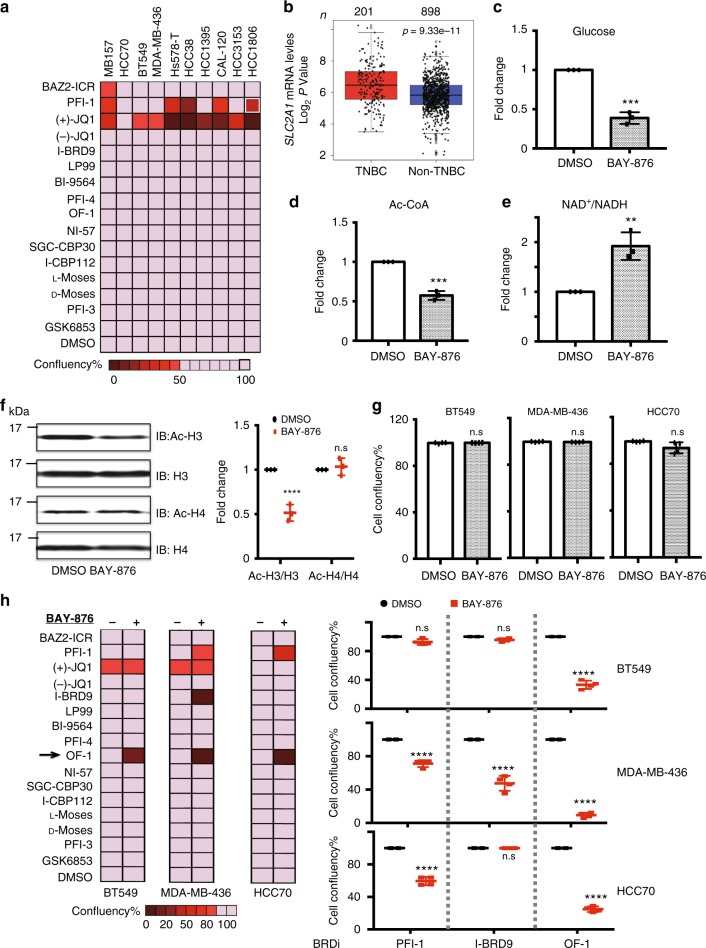
Bromodomains (BRDs) are conserved protein interaction modules which recognize (read) acetyl-lysine modifications, however their role(s) in regulating cellular states and their potential as targets for the development of targeted treatment strategies is poorly understood. Here we present a set of 25 chemical probes, selective small molecule inhibitors, covering 29 human bromodomain targets. We comprehensively evaluate the selectivity of this probe-set using BROMOscan and demonstrate the utility of the set identifying roles of BRDs in cellular processes and potential translational applications. For instance, we discovered crosstalk between histone acetylation and the glycolytic pathway resulting in a vulnerability of breast cancer cell lines under conditions of glucose deprivation or GLUT1 inhibition to inhibition of BRPF2/3 BRDs. This chemical probe-set will serve as a resource for future applications in the discovery of new physiological roles of bromodomain proteins in normal and disease states, and as a toolset for bromodomain target validation.


Conflict of interest statement

The authors declare no competing interests.

Figures

Fig. 1
Fig. 1
Chemical probes of the human bromodomain family. The set includes probes developed by our laboratory and a selection of additional inhibitors that are available. For each BRD family a single structural example of a chemical probe is shown. Additional probes are listed and a summary showing all chemical structures is included in Supplementary Table 1. BRD family members for which probes have been developed are highlighted in bold and by dark red lines in the dendrogram
Fig. 2
Fig. 2
Schematic representation of interaction sites of current set of bromodomain (BRD) chemical probes. Major sites of lysine acetylation on histone H3 and H4 are highlighted in red
Fig. 3
Fig. 3
Selectivity of bromodomain chemical probes and assay comparison. a Structure of bromosporine (BSP). b Structural/phylogenetic dendrograms quantifying binding affinities of BSP to human BRDs measured by BROMOscan (left), ITC (middle) and Tm assays (right). Affinities and Tm shifts are mapped to the phylogenetic tree using spheres of variable sizes as indicated in the inset. Screened targets are annotated on the dendrograms. c Heatmap of measured BROMOscan KD values calculated from 10-data point dose–response curves. d Correlation of dissociation constants (KD) measured by ITC and BROMOscane Correlation of Tm shifts and dissociation constants (KD) measured by BROMOscan
Fig. 4
Fig. 4
Influence of bromodomain inhibition on C2C12 myoblast differentiation. a Fluorescent images of myotubes cultured in differentiation media (Dulbecco’s modified Eagle’s medium (DMEM) containing 2% horse serum, 10 µgml−1 insulin, and 10 µgml−1 transferrin) in the presence or absence of bromodomain chemical probes. Cells were allowed to differentiate for 48 h before they were processed for immunofluorescence staining with α-myosin heavy-chain antibody (Red). Nuclei are stained blue with 4′,6-diamidino-2-phenylindole (DAPI). Images were acquired at ×10 using Zeiss Axio Observer Z1 microscope. b Quantitation of differentiated cells after inhibitor treatment. Post immunofluorescence, differentiation index was calculated by dividing the number of nuclei in myosin heavy-chain-expressing myotubes by the total number of nuclei per field. For JQ1 and BSP, the differentiation index declined significantly [****p < 0.0001] while treatment with GSK2801 slightly improved the differentiation index [**p < 0.0053]. Treatment with BAZ2-ICR (p = 0.1773) and LP99 (p = 0.1959) did not have significant impact on the differentiation index. P-values were calculated using two-tailed t test and error bars represent standard deviation (s.d., n = 3). c Heatmap of the top 50 statistically significant genes that were differentially expressed (using the Benjamini-Hochberg adjusted p-value < 0.001) following 12 h treatment with specific BRD inhibitors
Fig. 5
Fig. 5
Transcriptional response to BSP and JQ1 in C2C12 myoblasts. a Volcano plot of differentially expressed genes following 12 h treatment with BSP (left) or JQ1 (right) in C2C12 myoblasts. The top 10 genes are sorted by their fold change and are highlighted and colored in red (up-regulated) or blue (down-regulated). b Heatmap of the top 50 up/down-regulated genes in C2C12 myoblasts following 12 h BSP treatment based on two-sided signal-to-noise ratio (SNR) score and p < 0.05 calculated by the Benjamini-Hochberg t test. Dark blue indicates lowest expression; dark red indicates highest expression, with intermediate values represented by lighter shades, as indicated in the inset. Data are column normalized. c Gene set enrichment analysis (GSEA) demonstrating strong association with mitotic cell cycle (from the Gene Ontology (GO) MSigDB set, top left), G2M checkpoint (from hallmark MSigDB signatures, top-right), myogenesis (from hallmark MSigDB signatures, bottom-left), and interferon-γ (from hallmark MSigDB signatures, bottom-right) down-regulation signatures, following 12 h treatment of C2C12 cells with BSP. The plots show the running sum for the molecular signature database gene set within the C2C12/BSP data, including the maximum enrichment score and the leading edge subset of enriched genes. Normalized enrichment scores (NES) and false discovery rates (FDRs) are annotated in the insets. d GO enrichment (biological processes) for differentially expressed genes following 12 h treatment with JQ1 or BSP (calculated from differentially expressed genes with a Benjamini-Hochberg adjusted p-value < 0.001 and fold change >1.5)
Fig. 6
Fig. 6
BRD inhibitors leverage metabolic adaptations induced by glucose transporter I (GLUT1) inhibition in TNBC. a BRD inhibitor screening across ten TNBC cell lines. Cells were treated with indicated BRD inhibitors at 3 μM for 7 days. Confluency was measured using an IncuCyte ZOOM live cell imaging device. Data shown are mean ± s.d. of n = 4 independent cell culture grown and treated cells. A two-sided Student’s t test was used to derive the p-values. b SLC2A1 gene expression in the The Cancer Genome Atlas (TCGA) breast datasets. The cohorts were divided into TNBCs (red) and non-TNBCs (blue) according to PAM50 classification. Gene expression is reported as median-centered expression log2 values. The number of patients (n) per group is indicated. P-values were determined using a Wilcoxon's rank-sum test. c Glucose uptake in MDA-MB-436 cells in response to BAY-876 treatment relative to vehicle. MDA-MB-436 cells were treated with dimethyl sulfoxide (DMSO) or 3 µM BAY-876 for 5 days. Graph indicates mean, error bars denote s.d. from three independent assays and p-value was computed using the Benjamini-Hochberg t test; ***p < 0.001. d Effects of BAY-876 treatment on the intracellular acetyl-CoA level. Graph indicates mean, error bars denote s.d. from three independent assays and p-value was computed using the Benjamini-Hochberg t test; ***p < 0.001. e Effects of BAY-876 treatment on intracellular NAD+/NADH level. Graph indicates the mean, error bars denote s.d. from three independent assays and p-value computed using the Benjamini-Hochberg t test; **p < 0.01. f Immunoblot analysis of H3 and H4 acetylation in MDA-MB-436 cells before and after BAY-876 treatment. P-value computed using the Benjamini-Hochberg t test; ***p < 0.001. g Cell growth effects of BAY-876 treatment on three representative cell lines. n.s. not significant. h Combinatorial screening of BRD inhibitors with or without 3 μM BAY-876 across ten TNBC cell lines. Cell confluency was obtained from the endpoint Incucyte scanning. (Left) Heatmap of the combinatorial screening results; (Right) Cell confluency after treatment with three potential BRDi candidates at 3 μM in the presence or absence of 3 μM BAY-876 in three representative cell lines. Graph indicates mean, error bars denote s.d. from three independent assays and p-values were computed using the Benjamini-Hochberg t test; **p < 0.01; ***p < 0.001. Raw data images are available in Supplementary Fig. 4
Fig. 7
Fig. 7
BRD inhibitors reveal a metabolic/epigenetic circuit involving HBO1 in TNBC. a Dose-dependent curves for cells lines treated with indicated concentrations of OF-1 with or without 3 μM BAY-876 for 7 days. Graph indicates mean, error bars denote s.d. from eight wells (from two independent assays) and p-value was computed using the Benjamini-Hochberg t test; ***p < 0.001. b Average IC50 values of OF-1 in cells cultured under a range of glucose concentrations for the indicated three TNBC cell lines. Cells were treated with increasing doses of OF-1 for 7 days and the number of viable cells was determined by Incucyte ZOOM live cell imaging device. Error bars denote the s.d. values of independent experiments. c Confluency of MDA-MB-436 cells treated with indicated 3 μM BRPF inhibitors: OF-1, NI-57, and PFI-4 for 7 days. Graph indicates mean, error bars denote s.d. from eight wells (from two independent assays) and p-value was computed using the Benjamini-Hochberg t test; ***p < 0.001. d Immunoblot validation of BRPF knockdown in MDA-MB-436 cells. e Quantitative real-time PCR (RT-qPCR) validation of BRPF knockdown in MDA-MB-436 cells. P-value computed using Benjamini-Hochberg t test; ***p < 0.001. f Dose-dependent response of BAY-876 in BRPF-knockdown cell lines. g Immunoblot analysis of H3K14 acetylation in MDA-MB-436 cells following BAY-876 and BRPF inhibitor treatment for 5 days. h Immunoblot analysis of H3K14 acetylation in MDA-MB-436-knockdown lines. i Schematic illustration of a metabolic/epigenetic circuit involving GLUT1 and HBO1. Raw data images are available in Supplementary Fig. 4

References

    1. Allis CD, Jenuwein T. The molecular hallmarks of epigenetic control. Nat. Rev. Genet. 2016;17:487–500. doi: 10.1038/nrg.2016.59. - DOI - PubMed
    1. Eskeland R, Freyer E, Leeb M, Wutz A, Bickmore WA. Histone acetylation and the maintenance of chromatin compaction by Polycomb repressive complexes. Cold Spring Harb. Symp. Quant. Biol. 2010;75:71–78. doi: 10.1101/sqb.2010.75.053. - DOI - PubMed
    1. Dawson MA, Kouzarides T. Cancer epigenetics: from mechanism to therapy. Cell. 2012;150:12–27. doi: 10.1016/j.cell.2012.06.013. - DOI - PubMed
    1. Zeng L, Zhou MM. Bromodomain: an acetyl-lysine binding domain. FEBS Lett. 2002;513:124–128. doi: 10.1016/S0014-5793(01)03309-9. - DOI - PubMed
    1. Filippakopoulos P, et al. Histone recognition and large-scale structural analysis of the human bromodomain family. Cell. 2012;149:214–231. doi: 10.1016/j.cell.2012.02.013. - DOI - PMC - PubMed

Publication types

MeSH terms