. 2019 Apr 23;10(1):1829.
doi: 10.1038/s41467-019-09646-4.

The future of Southeast Asia's forests

Affiliations

The future of Southeast Asia's forests

Ronald C Estoque et al. Nat Commun. .

Erratum in

  • Author Correction: The future of Southeast Asia's forests.
    Estoque RC, Ooba M, Avitabile V, Hijioka Y, DasGupta R, Togawa T, Murayama Y. Estoque RC, et al. Nat Commun. 2023 Aug 30;14(1):5290. doi: 10.1038/s41467-023-41060-9. Nat Commun. 2023. PMID: 37648690 Free PMC article. No abstract available.

Abstract

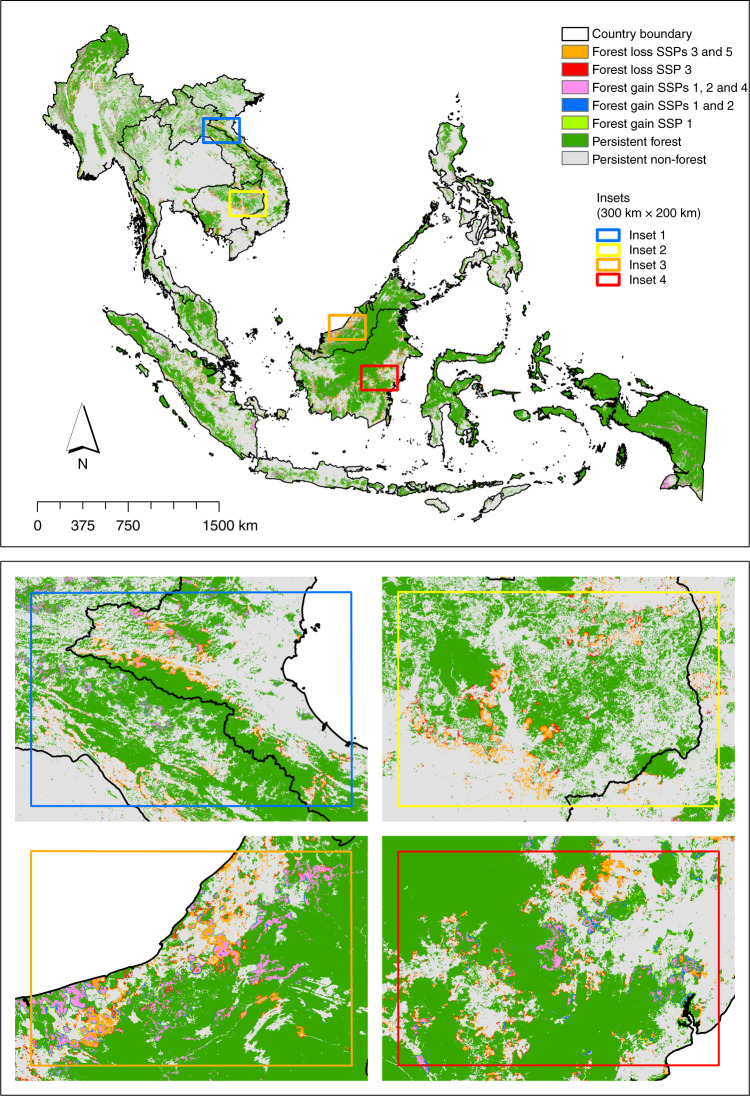
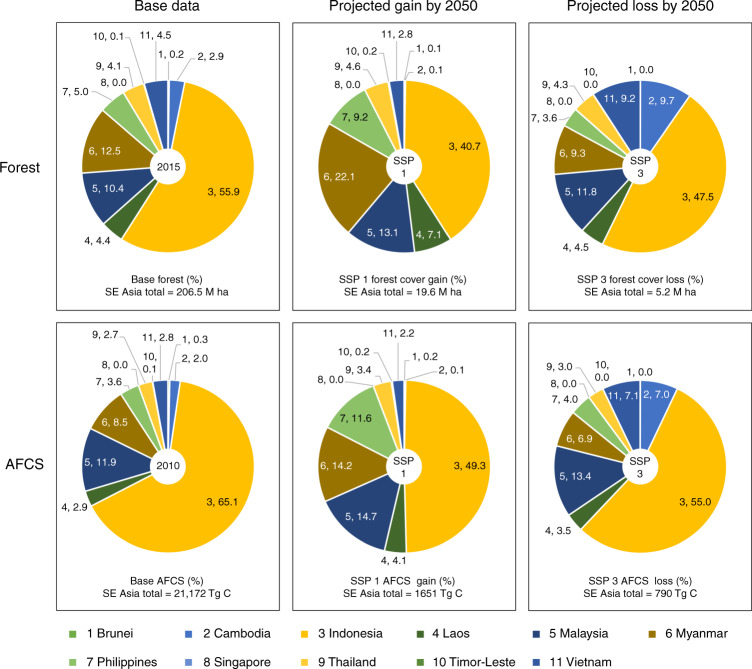
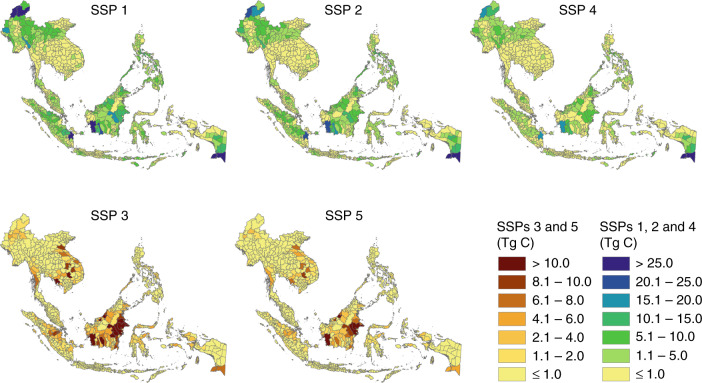
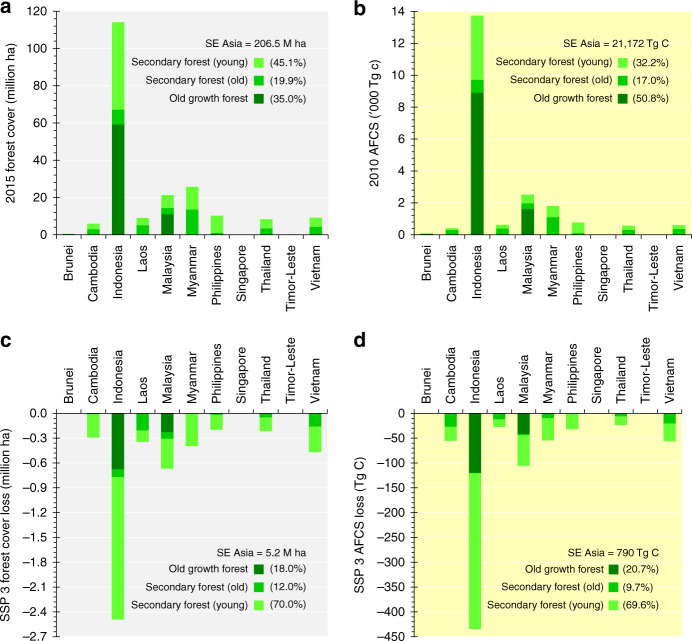
While Southeast Asia's forests play important roles in biodiversity conservation and global carbon (C) balance, the region is also a deforestation hotspot. Here, we consider the five shared socioeconomic pathways (SSPs) to portray a range of plausible futures for the region's forests, employing a state-of-the-art land change modelling procedure and remotely sensed data. We find that by 2050 under the worst-case scenario, SSP 3 (regional rivalry/a rocky road), the region's forests would shrink by 5.2 million ha. The region's aboveground forest carbon stock (AFCS) would decrease by 790 Tg C, 21% of which would be due to old-growth forest loss. Conversely, under the best-case scenario, SSP 1 (sustainability/taking the green road), the region is projected to gain 19.6 million ha of forests and 1651 Tg C of AFCS. The choice of the pathway is thus critical for the future of the region's forests and their ecosystem functions and services.


Conflict of interest statement

The authors declare no competing interests.

Figures

Fig. 1
Fig. 1
Maps showing the spatially allocated projected forest cover changes in Southeast Asia under the five shared socioeconomic pathways (SSPs) (2015–2050). The four insets show the spatially allocated projected forest cover changes in some parts of Laos and Vietnam (inset 1), Cambodia (inset 2), Malaysia (inset 3) and Indonesia (inset 4)
Fig. 2
Fig. 2
Country-level distribution of current forest cover and aboveground forest carbon stock (AFCS) and the projected forest cover and AFCS gains and losses (2015–2050) in Southeast Asia. In each section of the pie charts, the first numerical value refers to the country number, which corresponds to the country number in the figure legend, and the second refers to the percentage share of the country relative to the region’s total. Base AFCS is based on the extent of forest cover in 2015. In this figure, only the best-case (SSP 1) and worst-case (SSP 3) scenarios are presented. The data for SSPs 2, 4 and 5, including the complete statistics of forest cover and AFCS changes, are given in Supplementary Table 2
Fig. 3
Fig. 3
Province level distribution of the projected aboveground forest carbon stock (AFCS) gains and losses in Southeast Asia (2015–2050). Under the worst-case scenario (SSP 3), 17 of the top 30 AFCS-losing provinces were found in Indonesia, while the rest were found in Cambodia (3), Malaysia (3), Myanmar (3), Laos (2) and Vietnam (2). Under the best-case scenario (SSP 1), 17 of the top 30 AFCS-gaining provinces were also found in Indonesia, while the rest were found in Myanmar (7), Malaysia (3), Philippines (1), Laos (1) and Thailand (1). The top 30 provinces under each SSP are given in Supplementary Table 3. Note: Indonesia—regency level; Myanmar and Malaysia—district level
Fig. 4
Fig. 4
Forest cover and aboveground forest carbon stock (AFCS) in Southeast Asia, and their respective losses by 2050 across forest classes under the worst-case scenario (SSP 3). Country-level distribution of the current forest cover and AFCS considering forest classes (a, b) and country-level distribution of projected forest cover and AFCS losses across forest classes (c, d). For (b), the extent of forest in 2015 was used. The graph for the other forest-losing scenario, SSP 5, is presented in Supplementary Figure 3

References

    1. DeFries R, Hansen A, Newton AC, Hansen MC. Increasing isolation of protected areas in tropical forests over the past twenty years. Ecol. Appl. 2005;15:19–26. doi: 10.1890/03-5258. - DOI
    1. Bierregaard, R. O., Jr, Lovejoy, T. E., Kapos, V., dos Santos, A. A., Hutchings, R. W. The biological dynamics of tropical rainforest fragments. BioScience42, 859–866 (1992).
    1. Mitchard ETA. The tropical forest carbon cycle and climate change. Nature. 2018;559:527–534. doi: 10.1038/s41586-018-0300-2. - DOI - PubMed
    1. Baccini A, et al. Estimated carbon dioxide emissions from tropical deforestation improved by carbon-density maps. Nat. Clim. Chang. 2012;2:182–185. doi: 10.1038/nclimate1354. - DOI
    1. Bebber DP, Butt N. Tropical protected areas reduced deforestation carbon emissions by one third from 2000–2012. Sci. Rep. 2017;7:14005. doi: 10.1038/s41598-017-14467-w. - DOI - PMC - PubMed

Publication types