. 2019 Apr 23;10(1):1856.
doi: 10.1038/s41467-019-09834-2.

Molecular subtyping reveals immune alterations associated with progression of bronchial premalignant lesions

Affiliations

Molecular subtyping reveals immune alterations associated with progression of bronchial premalignant lesions

Jennifer E Beane et al. Nat Commun. .

Abstract

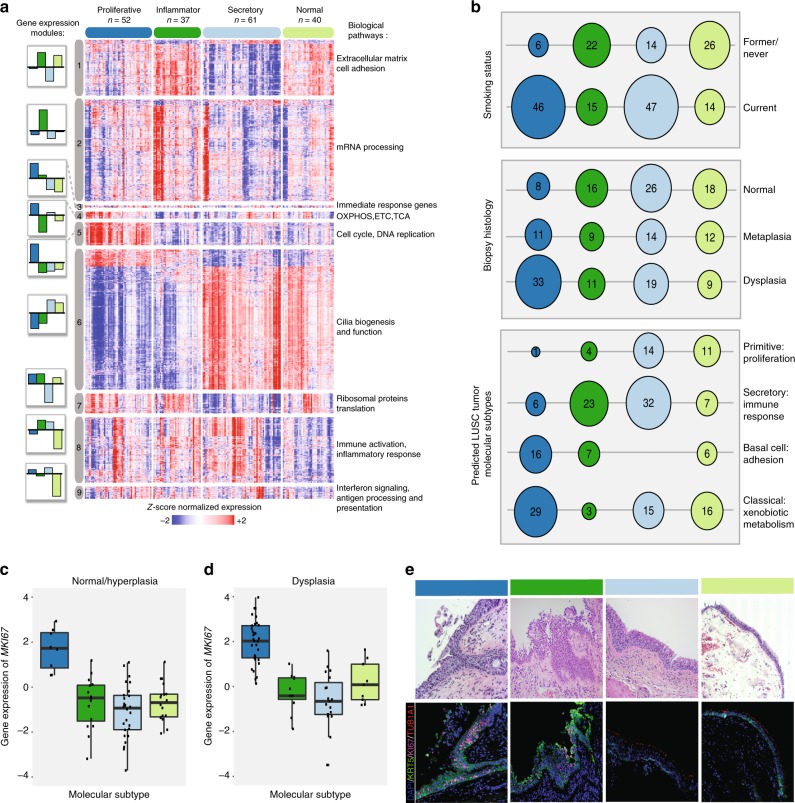
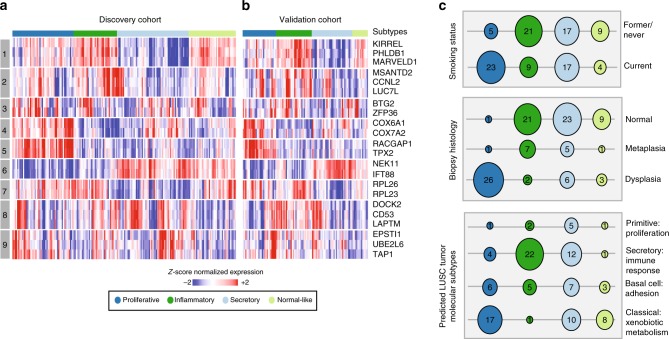
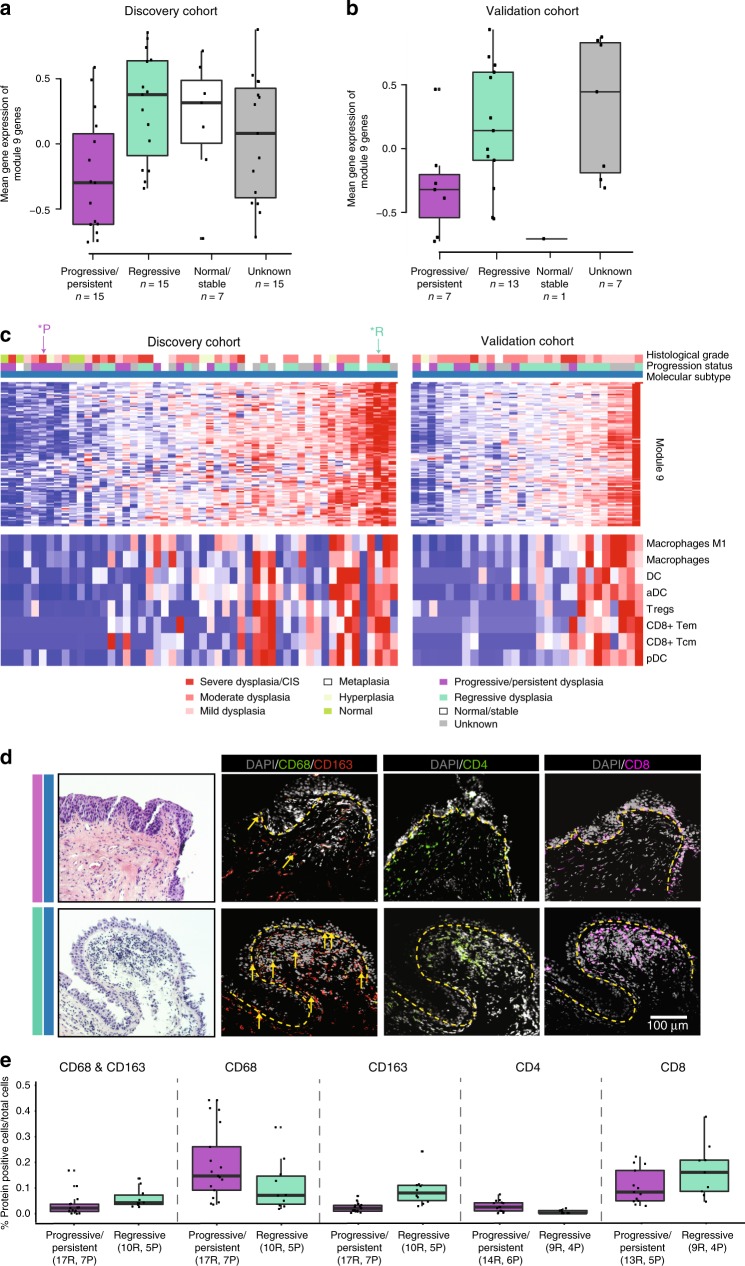
Bronchial premalignant lesions (PMLs) are precursors of lung squamous cell carcinoma, but have variable outcome, and we lack tools to identify and treat PMLs at risk for progression to cancer. Here we report the identification of four molecular subtypes of PMLs with distinct differences in epithelial and immune processes based on RNA-Seq profiling of endobronchial biopsies from high-risk smokers. The Proliferative subtype is enriched with bronchial dysplasia and exhibits up-regulation of metabolic and cell cycle pathways. A Proliferative subtype-associated gene signature identifies subjects with Proliferative PMLs from normal-appearing uninvolved large airway brushings with high specificity. In progressive/persistent Proliferative lesions expression of interferon signaling and antigen processing/presentation pathways decrease and immunofluorescence indicates a depletion of innate and adaptive immune cells compared with regressive lesions. Molecular biomarkers measured in PMLs or the uninvolved airway can enhance histopathological grading and suggest immunoprevention strategies for intercepting the progression of PMLs to lung cancer.


Conflict of interest statement

JEB, SAM, JDC, CP, JV, MER, MEL, and AES received commercial research grants from Janssen Pharmaceuticals. MEL is a consultant to Veracyte. AES, MS, CM, and CS are employed by Johnson and Johnson. SJP was employed by Johnson and Johnson during the study and is now employed by Covance. GD, KK, GL, SZ, HL, SSD, and SMD declare no competing interests.

Figures

Fig. 1
Fig. 1
Endobronchial biopsies divide into four distinct molecular subtypes that correlate with clinical and molecular phenotypes. a Genes (n = 3936) organized into nine gene co-expression modules were used to discover four molecular subtypes (Proliferative, Inflammatory, Secretory, and Normal-like) across the 190 DC biopsies using consensus clustering. The heatmap shows semi-supervised hierarchal clustering of z-score-normalized gene expression across the 3936 genes and 190 DC biopsies. The top color bar represents the four molecular subtypes: Proliferative (n = 52 samples), Inflammatory (n = 37 samples), Secretory (n = 61 samples), and Normal-like (n = 40 samples). To the left of the heatmap, barplots for each module show the mean module GSVA score for each subtype. To the right of the heatmap, a summary of enriched biological pathways is listed for each module. b Bubbleplots showing significant associations (p < 0.01, two-sided Fisher’s exact test) between the molecular subtypes and genomic smoking status, biopsy histological grade, and the predicted LUSC tumor molecular subtypes. The columns represent the four molecular subtypes (Proliferative, Inflammatory, Secretory, and Normal-like) and the diameter of the circle is proportional to the number of samples within each subtype that have the row phenotype. c Boxplot of MKI67 expression values in biopsies with normal or hyperplasia histology (n = 8, 16, 26, 18 in Proliferative, Inflammatory, Secretory, and Normal-like subtypes, respectively). The MKI67 expression levels of the Proliferative subtype are significantly greater than non-Proliferative subtype samples (FDR = 3.4e-10, linear model). d Boxplot of expression values of MKI67 in biopsies with dysplastic histology (n = 33, 11, 19, 9 in Proliferative, Inflammatory, Secretory, and Normal-like subtypes, respectively). The MKI67 expression levels of the Proliferative subtype are significantly greater than non-Proliferative subtype samples (FDR = 3.1e-8). e Immunofluorescent staining demonstrating the increased MKI67 and KRT5 staining and reduced TUB1A1 staining in the Proliferative subtype. The representative samples shown for the Proliferative and Inflammatory subtypes have dysplasia histology, whereas the samples shown for the Secretory and Normal-like subtypes have normal histology (Magnification ×  200). In the boxplots, the upper and lower hinges correspond to the first and third quartile, center line represents the median, and whiskers extend from the hinge to the largest or smallest value at most 1.5 times the distance between the quartiles. Source data are provided as a Source Data file
Fig. 2
Fig. 2
Phenotypic associations with the molecular subtypes are confirmed in an independent sample set. a The 190 DC biopsies and the 3936 genes were used to build a 22-gene nearest centroid molecular subtype classifier. The heatmap shows semi-supervised hierarchal clustering of z-score normalized gene expression across the 22 classifier genes and 190 DC biopsies training samples. b The 22-gene nearest centroid molecular subtype classifier was used to predict the molecular subtypes of the 105 VC biopsies. The heatmap shows semi-supervised hierarchal clustering of z-score normalized gene expression across 22 genes and 105 VC. The rows of the heatmap give the gene name and module membership, and the column color bar shows molecular subtype membership. c Bubbleplots showing significant associations (p < 0.01 by two-sided Fisher’s exact test) between the VC molecular subtypes and smoking status, biopsy histological grade, and the predicted LUSC tumor molecular subtypes. The columns represent the four molecular subtypes (Proliferative, Inflammatory, Secretory, and Normal-like) and the radius of the circle is proportional to the number of samples within each subtype that have the row phenotype. Source data are provided as a Source Data file
Fig. 3
Fig. 3
Normal-appearing bronchial brushes predict the presence of proliferative lesions. a The DC (left) and VC (right) cohorts, showing the number of brushes (y axis) classified as proliferative orange) that have at least one biopsy (y axis) classified as proliferative at the time the brush was sampled. Brushes/biopsies classified as not proliferative are turquoise. b Boxplots of GSVA scores for modules 4, 5, 6, and 7 (y axis) across all brushes (n = 86 in DC and n = 48 in VC) and biopsies (n = 190 in DC and n = 105 in VC) from each cohort classified as Proliferative or not Proliferative (x axis). The red asterisk indicates significant differences between the Proliferative subtype versus all other samples (FDR < 0.05, linear model). In the boxplots, the upper and lower hinges correspond to the first and third quartile, center line represents the median, and whiskers extend from the hinge to the largest or smallest value at most 1.5 times the distance between the quartiles. Source data are provided as a Source Data file
Fig. 4
Fig. 4
Immune alterations are associated with lesion outcome in the Proliferative subtype. Boxplots of Module 9 GSVA scores across DC a and VC biopsies b within the Proliferative subtype. There is a significant difference between the progressive/persistent versus regressive biopsies (p = 0.002 (DC) and p = 0.03 (VC), linear models). c Top: heatmap of z-score-normalized gene expression across the 112 genes in Module 9 in the DC biopsies (left) and the VC biopsies (right). Each heatmap is supervised by Module 9 GSVA scores. Top color bars indicate the histological grade of the biopsies and their progression status. Bottom: heatmap of xCell results indicating the relative abundance of immune cell types across the DC biopsies (left) and the VC biopsies (right). Immune cell types displayed are significantly associated with lesion progression/persistence (FDR < 0.05 in both the DC and VC, linear model). d Representative histology where the dashed yellow line denotes the separation of epithelium and stromal compartments. Top panels: a progressive severe dysplasia has reduced presence of immune cells demonstrated by the marked reduction in expression of M2 macrophages (CD68/163 staining, double-positive cells indicated by the yellow arrows) and CD8 T cells (sample corresponds to *P in c). Bottom panels: a regressive moderate dysplasia has increased presence of immune cells including M2 macrophages (CD68/163 staining double-positive cells indicated by the yellow arrows) and CD8 T cells (samples correspond to *R in c). e Boxplots of the percentages of CD68 and CD163, CD68, CD163, CD4, and CD8 positively stained cells between progressive/persistent and regressive biopsies (p < 0.001, linear model, for all comparisons). The x axis labels indicate the number of regions (R) enumerated across (P) subjects for each stain and outcome group depicted in the boxplot. Biopsies were included in the analysis if their clinical outcome was concordant with the Module 9 score. In the boxplots, the upper and lower hinges correspond to the first and third quartile, center line represents the median, and whiskers extend from the hinge to the largest or smallest value at most 1.5 times the distance between the quartiles. Source data are provided as a Source Data file

References

    1. Campbell JD, et al. The case for a Pre-Cancer Genome Atlas (PCGA) Cancer Prev. Res. (Philos.) 2016;9:119–124. doi: 10.1158/1940-6207.CAPR-16-0024. - DOI - PubMed
    1. Beane J, Campbell JD, Lel J, Vick J, Spira A. Genomic approaches to accelerate cancer interception. Lancet Oncol. 2017;18:e494–e502. doi: 10.1016/S1470-2045(17)30373-X. - DOI - PMC - PubMed
    1. Auerbach O, Stout AP, Hammond EC, Garfinkel L. Changes in bronchial epithelium in relation to cigarette smoking and in relation to lung cancer. N. Engl. J. Med. 1961;265:253–267. doi: 10.1056/NEJM196108102650601. - DOI - PubMed
    1. van Boerdonk RAA, et al. Close surveillance with long-term follow-up of subjects with preinvasive endobronchial lesions. Am. J. Respir. Crit. Care Med. 2015;192:1483–1489. doi: 10.1164/rccm.201504-0822OC. - DOI - PubMed
    1. Merrick DT, et al. Persistence of bronchial dysplasia is associated with development of invasive squamous cell carcinoma. Cancer Prev. Res. 2016;9:96–104. doi: 10.1158/1940-6207.CAPR-15-0305. - DOI - PMC - PubMed

Publication types

MeSH terms