. 2019 Apr 23;10(1):1862.
doi: 10.1038/s41467-019-09880-w.

A suite of phenotypic assays to ensure pipeline diversity when prioritizing drug-like Cryptosporidium growth inhibitors

Affiliations

A suite of phenotypic assays to ensure pipeline diversity when prioritizing drug-like Cryptosporidium growth inhibitors

Rajiv S Jumani et al. Nat Commun. .

Abstract

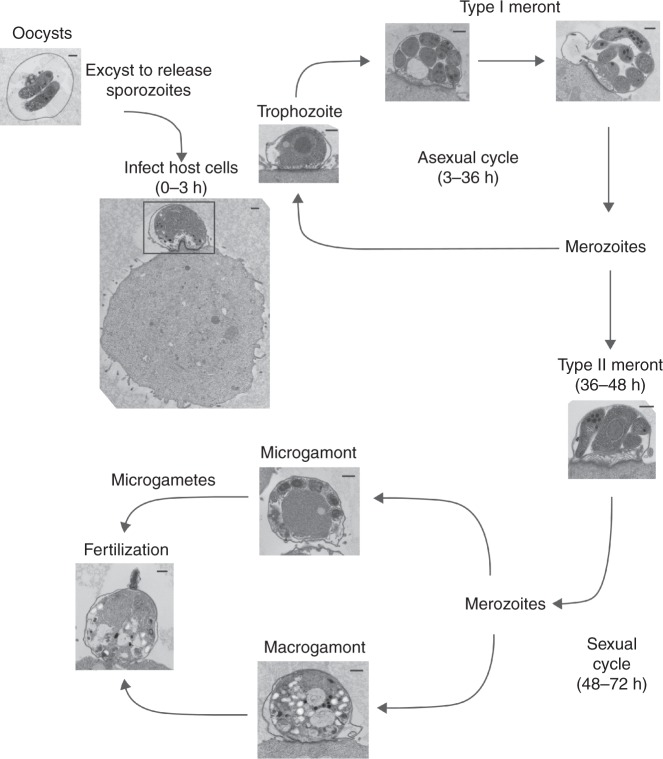
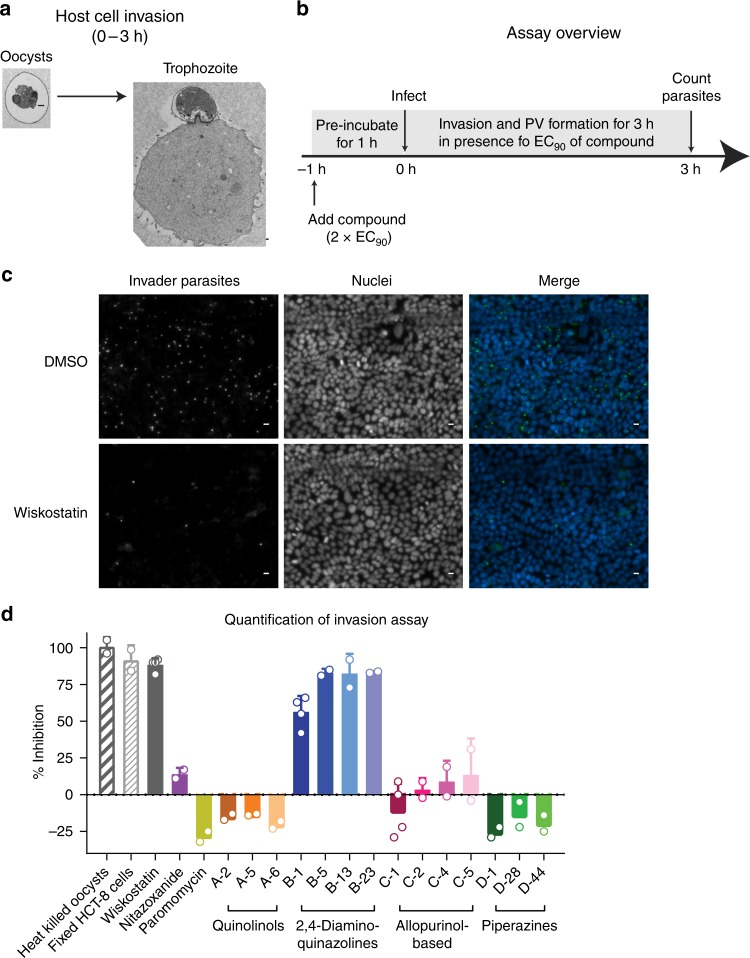
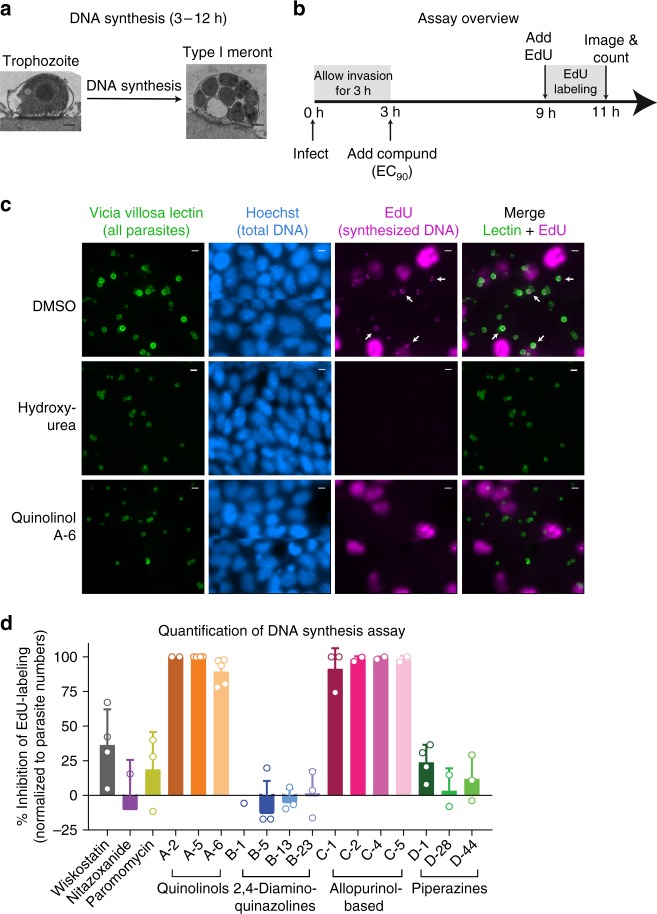
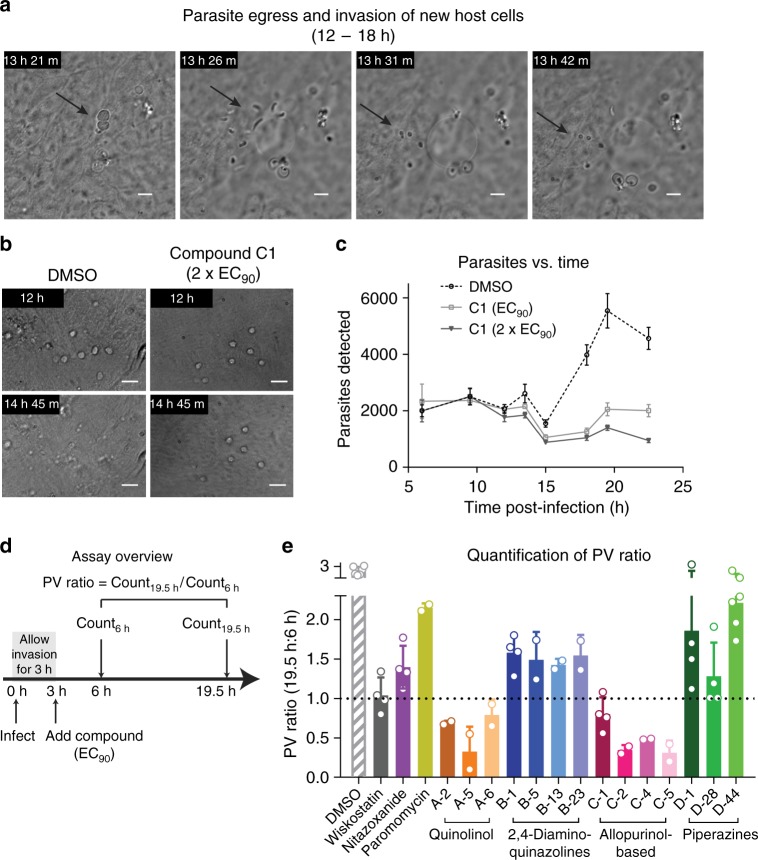
Cryptosporidiosis is a leading cause of life-threatening diarrhea in children, and the only currently approved drug is ineffective in malnourished children and immunocompromised people. Large-scale phenotypic screens are ongoing to identify anticryptosporidial compounds, but optimal approaches to prioritize inhibitors and establish a mechanistically diverse drug development pipeline are unknown. Here, we present a panel of medium-throughput mode of action assays that enable testing of compounds in several stages of the Cryptosporidium life cycle. Phenotypic profiles are given for thirty-nine anticryptosporidials. Using a clustering algorithm, the compounds sort by phenotypic profile into distinct groups of inhibitors that are either chemical analogs (i.e. same molecular mechanism of action (MMOA)) or known to have similar MMOA. Furthermore, compounds belonging to multiple phenotypic clusters are efficacious in a chronic mouse model of cryptosporidiosis. This suite of phenotypic assays should ensure a drug development pipeline with diverse MMOA without the need to identify underlying mechanisms.


Conflict of interest statement

The authors declare no competing interests.

Figures

Fig. 1
Fig. 1
Transmission electron microscopy images showing C. parvum life cycle stages present in the HCT-8 cell culture system. C. parvum oocysts were induced to excyst and used to infect HCT-8 cell monolayers. Parasite morphology was then analyzed by transmission electron microscopy (TEM) at different time points ranging from 12 to 96 h after infection. The approximate timing of each stage is indicated. Scale bars = 500 nm. Images are representative of two independent experiments
Fig. 2
Fig. 2
Invasion Assay. a Overview of life cycle stage investigated during the invasion assay. Representative TEM images of a C. parvum oocyst and HCT-8 cell shortly after infection (Scale bar = 500 nm). b Schematic of experimental design. Confluent HCT-8 monolayers were treated with 2 × EC90 of compounds for 1 h followed by infection with oocysts. Oocysts induced to excyst were incubated on HCT-8 cell monolayers for 3 h in the presence of EC90 of compounds, after which cells were washed, fixed, and parasite vacuoles were stained with a fluorescein-Vicia villosa lectin conjugate. c Representative images of parasite vacuoles (i.e., invaded parasites (green)) and host cell nuclei (blue) after treatment with DMSO control or EC90 (11.34 µM) of wiskostatin. Scale = 10 µm. d Quantified results for selected controls and compounds. The 2,4-diaminoquinazoline series (parent B-1 (MMV006169)) from the MMV Malaria Box inhibited invasion. Each point represents the mean and SD of at least two biological replicates with four technical replicates per experiment. Source data are provided as a Source Data file
Fig. 3
Fig. 3
DNA Replication Assay. a TEM images of C. parvum infected HCT-8 cells demonstrating parasite morphology at the time point that the DNA replication assay is performed (Scale = 500 nm). b Overview of the experimental method. Confluent HCT-8 cell monolayers in glass bottom plates were infected with C. parvum, and compounds were added at EC90 following invasion. At 9 h post-infection, 10 µM EdU was added, followed by incubation for another 2 h, and then washing, fixing, and staining for microscopy. Note that images were acquired by focusing on parasite vacuoles, which typically reside in a different focal plane from the host cell nuclei. c Representative images of parasitophorous vacuoles (green), nuclei (blue) and EdU-labeling (magenta) after treatment with DMSO, EC90 of quinolinol A-6 (MMV000760) (1.33 µM), or 10 mM hydroxyurea. 40 × dry objective (NA = 0.7); scale = 5 µm. Arrows indicate selected parasites with EdU-labeled DNA. d Quantification of EdU incorporation. The compounds in the quinolinol and allopurinol-based series (denoted a and c, respectively) inhibited EdU incorporation. Data are mean and SD of 2–5 biological replicates. Source data are provided as a Source Data file
Fig. 4
Fig. 4
Assay to measure parasitophorous vacuole (PV) egress and invasion of new host cells. a Time-lapse microscopy showing the rapid events of PV egress to release motile merozoites that invade neighboring HCT-8 cells. 60 × oil objective (NA = 1.4); scale = 5 µm. b Time-lapse microscopy of C. parvum PVs in the presence of allopurinol-based compound C-1 (MMV403679) at 2 × EC90 (1.3 µM) or the matched DMSO control. 40 × dry objective (NA = 0.7); scale = 10 µm. c Time course infection experiment in the presence of DMSO or the allopurinol-based compound C-1 at EC90 or 2 × EC90. The graph shows PV numbers versus time for each condition. Data points are mean and SD, n = 4, representative of three independent experiments. d Outline of the experimental method for improved assay throughput. Infected HCT-8 cells were treated with EC90 of compounds 3 h after infection and PV numbers were determined at 6 h (i.e., before egress), and at 19.5 h (i.e., after egress) by immunofluorescence microscopy and an ImageJ macro. The PV ratio (count19.5 h/count6 h) is used as the assay readout. e Graph showing PV ratios for selected controls and the test set of compounds. All compounds reduced the PV ratio compared to DMSO, but to varying degrees and with good agreement within each chemical series. Data combined from at least two independent experiments (six for DMSO control) with four technical replicates each, mean and SD shown. Source data are provided as a Source Data file
Fig. 5
Fig. 5
DNA Meiotic Recombinase 1 (DMC1) is a biomarker for C. parvum sexual development. a Representative transmission electron microscopy (TEM) images and results of scoring the relative abundance of different C. parvum life cycle stages present versus time after infection of host cell monolayers. Confluent HCT-8 cells were infected with C. parvum for the indicated times before preparing samples for TEM. Scale bar = 500 nm. b C. parvum DMC1 mRNA versus time during HCT-8 cell infection. Wells from the same culture plate as in a were used to isolate RNA, and quantitative reverse transcription PCR (qRT-PCR) was used to measure expression of C. parvum DMC1 (cgd7_1690) relative to 18s RNA. Data for a and b are representative of two independent experiments. c Immunofluorescence microscopy showing specific DMC1 expression. A mouse monoclonal anti-C. parvum DMC1 antibody was made and used for immunofluorescence staining and epifluorescence microscopy. DMC1 expression was limited to a subset of parasite vacuoles that contained a single nucleus. Images were acquired 72 h after HCT-8 cell infection (all parasite vacuoles (V. Villosa lectin staining (green)), nuclei (Hoechst (blue)), and anti-DMC1 antibody staining (red)). 60 × oil objective (NA = 1.4); scale bar = 5 µm. Images are representative of two independent experiments. d Time course of DMC1 protein expression. Infected HCT-8 cell monolayers grown in 384-well plates were stained as in c at the indicated time points. Tiled 2 × 2 images (40 × dry objective, NA = 0.7) were used to determine the percent of DMC1 parasites versus time. The graph shows mean and SD for data combined from two biological replicates. Source data are provided as a Source Data file
Fig. 6
Fig. 6
Assay to measure asexual-to-sexual-stage conversion. a Schematic of the experimental approach. HCT-8 cells were infected for 48 h, after which experimental compounds were added and the cultures were incubated for an additional 24 h before immunofluorescence staining with V. villosa lectin and anti-DMC1 antibody, and high-content microscopy. b Representative dose-response curves for the asexual growth assay (i.e., first 48 h) and the sexual development assay (i.e., inhibition of DMC1 expression from 48 to 72 h). Examples are shown for the piperazine compound D1 (MMV665917) and for the 2,4-diaminoquinazoline B-1 (MMV006169). c Graph showing the percent inhibition of DMC1 expression for control compounds and the test set of compounds. For b and c the mean and SD combined from at least two biological replicates with four technical replicates per experiment are shown. Source data are provided as a Source Data file
Fig. 7
Fig. 7
Dendrogram showing the results of a clustering analysis based on life cycle stage assay data for a diverse set of 39 Cryptosporidium growth inhibitors. Results from the life cycle stage assays were used to calculate a distance matrix using Euclidean distances from the mean control results, and the dendrogram was generated using the Ward error sum of squares hierarchical method. For the major nodes, bootstrap proportions ≥ 60% are shown (1000 bootstrap iterations). Singleton compounds, i.e., those with no known similarity to other compounds in the collection, are shown in black, and others are colored according to chemotype and/or putative mechanism of action. Compound structures and phenotypic assay results for each are shown in Supplementary Fig. 1 and Supplementary Table 2, respectively. NSG mouse efficacy studies performed on 31/39 compounds are summarized in Supplementary Table 3, and compounds with efficacy in the NSG mouse model at the dose tested are indicated with an arrow. Source data are in Supplementary Table 2

Similar articles

Cited by

References

    1. Disease GBD, Injury I, Prevalence C. Global, regional, and national incidence, prevalence, and years lived with disability for 310 diseases and injuries, 1990–2015: a systematic analysis for the Global Burden of Disease Study 2015. Lancet. 2016;388:1545–1602. doi: 10.1016/S0140-6736(16)31678-6. - DOI - PMC - PubMed
    1. Kotloff KL, et al. Burden and aetiology of diarrhoeal disease in infants and young children in developing countries (the Global Enteric Multicenter Study, GEMS): a prospective, case-control study. Lancet. 2013;382:209–222. doi: 10.1016/S0140-6736(13)60844-2. - DOI - PubMed
    1. Liu J, et al. Use of quantitative molecular diagnostic methods to identify causes of diarrhoea in children: a reanalysis of the GEMS case-control study. Lancet. 2016;388:1291–1301. doi: 10.1016/S0140-6736(16)31529-X. - DOI - PMC - PubMed
    1. Checkley W, et al. A review of the global burden, novel diagnostics, therapeutics, and vaccine targets for cryptosporidium. Lancet Infect. Dis. 2015;15:85–94. doi: 10.1016/S1473-3099(14)70772-8. - DOI - PMC - PubMed
    1. Shirley DA, Moonah SN, Kotloff KL. Burden of disease from cryptosporidiosis. Curr. Op. Infect. Dis. 2012;25:555–563. doi: 10.1097/QCO.0b013e328357e569. - DOI - PMC - PubMed

Publication types

MeSH terms