. 2019 Apr 23;10(1):1911.
doi: 10.1038/s41467-019-09555-6.

Multiple myeloma immunoglobulin lambda translocations portend poor prognosis

Affiliations

Multiple myeloma immunoglobulin lambda translocations portend poor prognosis

Benjamin G Barwick et al. Nat Commun. .

Abstract

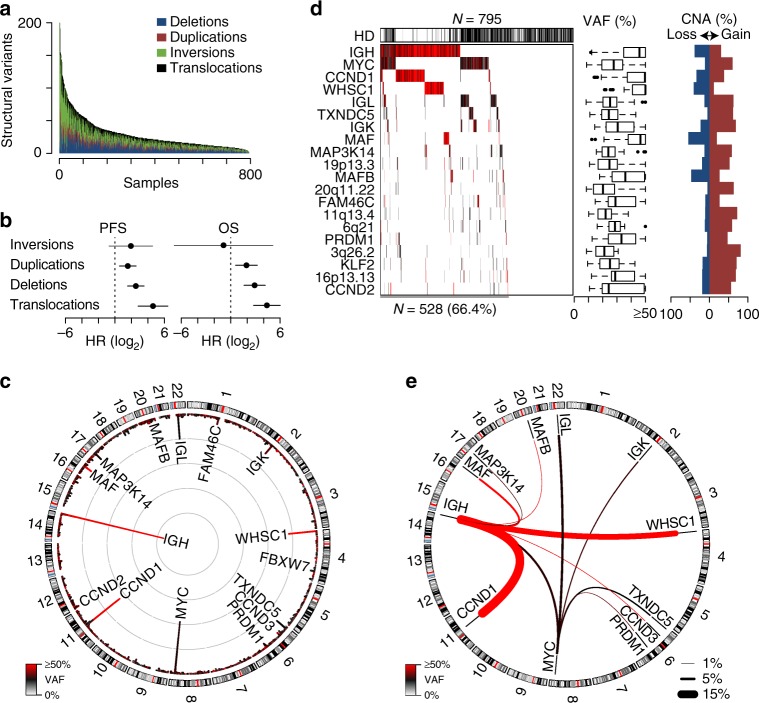
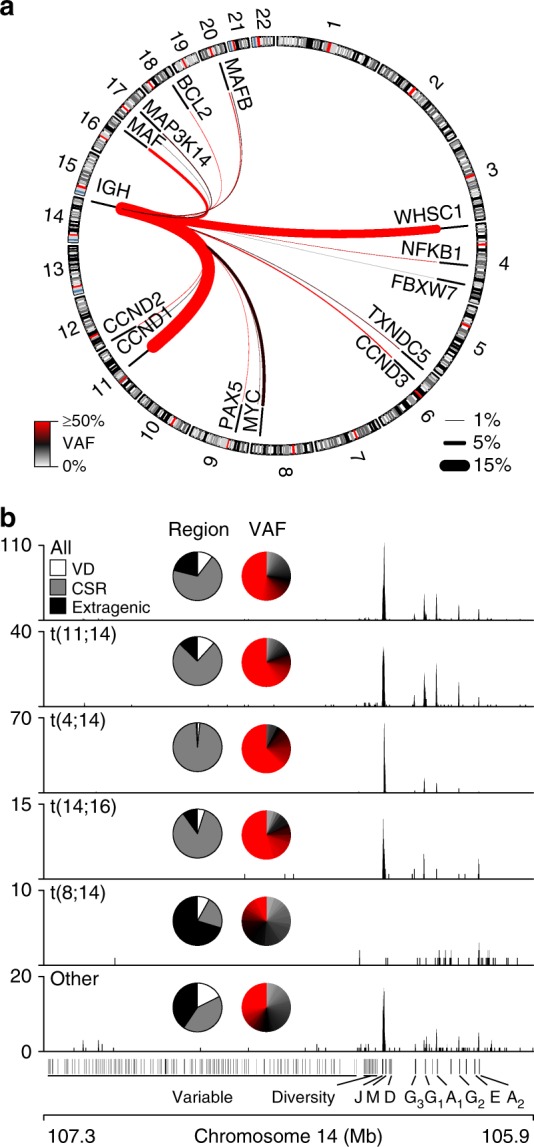
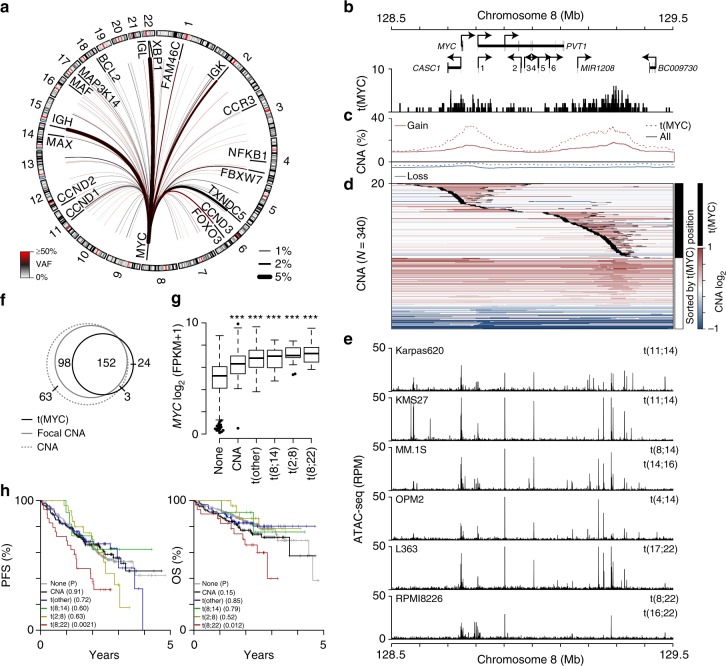
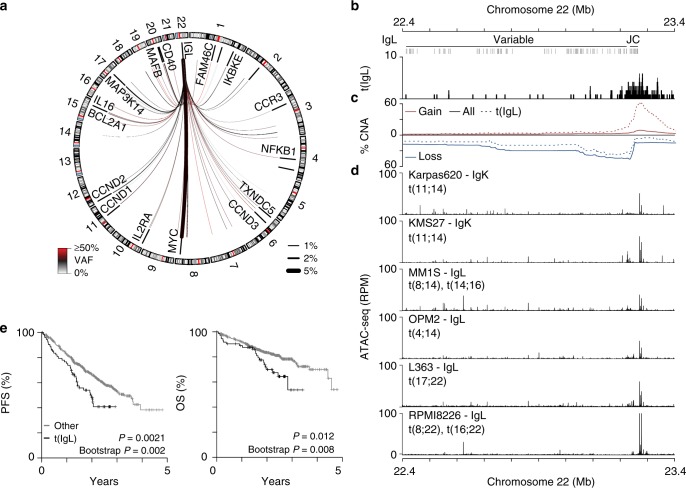
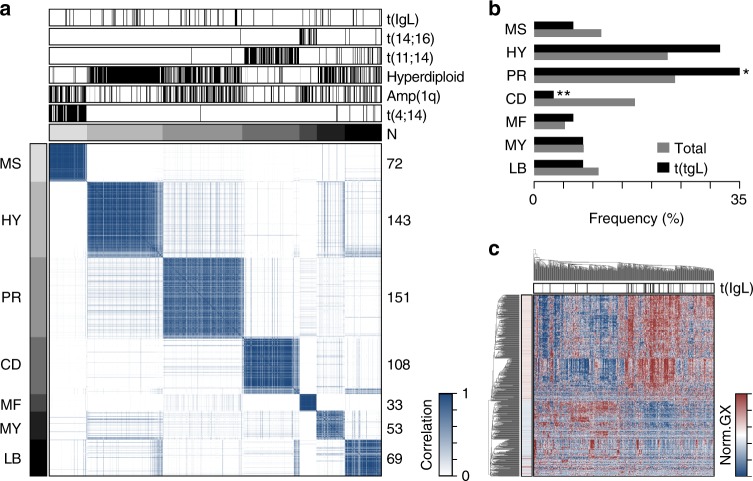
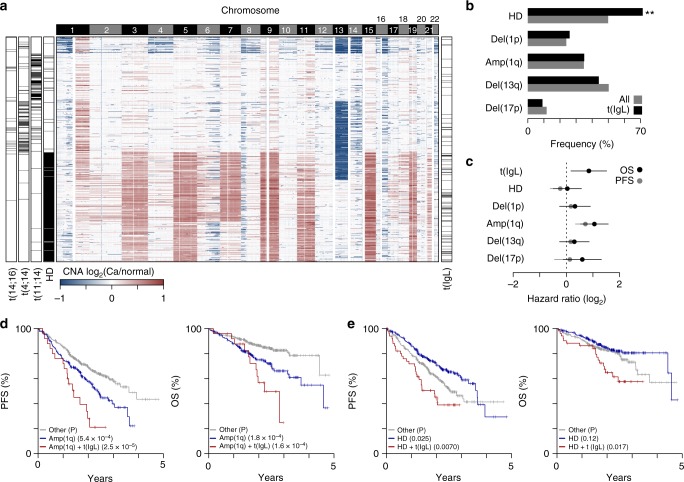
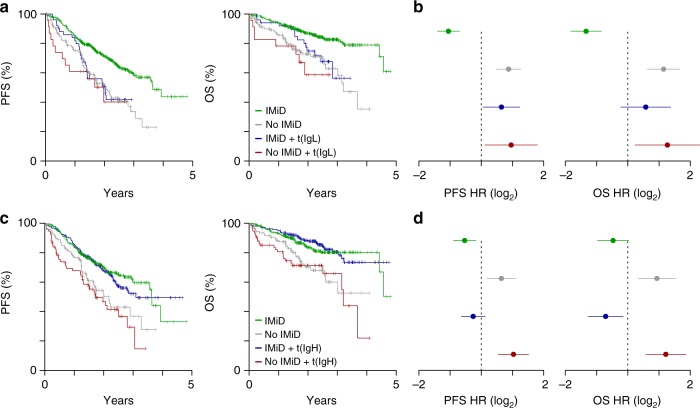
Multiple myeloma is a malignancy of antibody-secreting plasma cells. Most patients benefit from current therapies, however, 20% of patients relapse or die within two years and are deemed high risk. Here we analyze structural variants from 795 newly-diagnosed patients as part of the CoMMpass study. We report translocations involving the immunoglobulin lambda (IgL) locus are present in 10% of patients, and indicative of poor prognosis. This is particularly true for IgL-MYC translocations, which coincide with focal amplifications of enhancers at both loci. Importantly, 78% of IgL-MYC translocations co-occur with hyperdiploid disease, a marker of standard risk, suggesting that IgL-MYC-translocated myeloma is being misclassified. Patients with IgL-translocations fail to benefit from IMiDs, which target IKZF1, a transcription factor that binds the IgL enhancer at some of the highest levels in the myeloma epigenome. These data implicate IgL translocation as a driver of poor prognosis which may be due to IMiD resistance.


Conflict of interest statement

The authors declare no competing interests.

Figures

Fig. 1
Fig. 1
Structural variants correspond with poor prognosis. a The number of somatic structural variants per sample in 795 newly diagnosed myeloma specimens ordered by the total number of structural variants. Three samples are cropped at 200 structural variants, but have 1823, 529, and 257 SV. b Progression-free (PFS) and overall survival (OS) hazard ratios (HR) for structural variants indicating the increased hazard of having the maximum number of each structural variant, with 95% confidence intervals shown. c Circos plot of translocation frequency. The frequency of translocations is plotted on the inside with gray concentric circles denoting 10 percentiles per megabase and the color of each region represents the median variant allele frequency (VAF; key bottom left). Chromosome ideograms are represented and labelled on the outside. d Waterfall plot of translocated regions showing those present in ≥2% of newly diagnosed patients (left). Hyperdiploid (HD) status is denoted above. The VAF of each translocation is denoted in color and summarized in boxplots (middle) showing the median and quartiles with the whiskers extending to the most extreme data point within 1.5 times the interquartile range. The frequency of proximal (≤10 kb) copy number alterations (CNA) associated with each translocation are shown (right). e Circos plot of translocated regions prevalent in ≥1% of samples. The thickness and color of lines connecting two regions denotes the frequency and median VAF of the translocation, respectively (see keys bottom right and left). Hazard ratios were determined using a Cox proportional hazards regression Wald’s test as a function of the number of structural events. Source data are provided as a Source Data file
Fig. 2
Fig. 2
IgH translocations have distinct etiologies. a Circos plot of IgH translocations in newly diagnosed myeloma patients (N = 795). The frequency and median VAF of each type of translocation is denoted by the thickness and color of the line, respectively (key bottom left and right). b Genome (GRCh37) plots of translocations across the IgH region for all IgH translocations (top) or specific types of IgH translocations (below). Inset are pie charts depicting the percentage of translocations that occur in the variable and diversity (VD), class switch recombination (CSR) (+/−2.5 kb), and extragenic regions (left) and the VAF of each translocation. Source data are provided as a Source Data file
Fig. 3
Fig. 3
MYC translocations correspond with focal amplifications and aberrant expression. a Circos plot of MYC translocations in newly diagnosed myeloma (N = 795). The median VAF and frequency of each translocation is denoted by the color and thickness of the line, respectively (see keys bottom left and right). b Genome (GRCh37) plot of the MYC locus showing genes (arrows indicate the direction of transcription; 1: MIR1204, 2: TMEM75, 3: MIR1205, 4: U4, 5: MIR1206, 6: MIR1207), and the location of MYC translocations [t(MYC)]. c Frequency of copy number gains (red) and losses (blue) for all samples (solid line) and those with t(MYC) (dashed line). d A heatmap of copy number across the locus is shown for samples with either a MYC translocation (black) or only a CNA (white) sorted by the location of the MYC translocation, which are superimposed on the heatmap as 10 kb black regions. e ATAC-seq for 6 myeloma cell lines across the locus is shown below (RPM: reads per million). f Venn diagram of samples with a CNA at the MYC locus (dashed gray line), CNA boundary (solid gray line), or MYC translocation (black line). g Gene expression of MYC in samples with RNA-seq data (N = 611) for patients with no MYC alteration (none; N = 382), MYC CNA only (N = 83), MYC translocations to non-immunoglobulin genes [t(other); N = 81], IgH-MYC translocations [t(8;14); N = 27], IgK-MYC translocations [t(2;8); N = 13], and IgL-MYC translocations [t(8;22); N = 25]. ***P < 0.001, analysis of variance with Tukey’s post hoc test. Boxplots show the median and quartiles with the whiskers extending to the most extreme data point within 1.5 times the interquartile range. h Progression-free (PFS; left) and overall survival (OS; right) for patients stratified by MYC structural variant type as in part g. P-values are shown in parenthesis and were calculated using a Cox proportional hazards Wald's test and denote the significance of survival differences relative to myelomas without a detectable MYC structural variant (none). Source data are provided as a Source Data file
Fig. 4
Fig. 4
IgL translocations portend poor prognosis. a Circos plot showing the repertoire of IgL translocations in newly diagnosed myeloma where line color and thickness denote variant allele frequency (VAF) and translocation frequency (keys bottom left and right). b Genome plot (GRCh37) of the IgL locus showing the variable, joining (J), and constant (C) regions and locations of translocation breakpoints. c The frequency of copy number gains (red) and losses (blue) in the entire cohort (solid line) and in t(IgL) samples (dashed line), and d ATAC-seq for 6 myeloma cell lines labelled with their light chain expression status and known translocations denoted. e Kaplan-Meier analysis of IgL translocated [t(IgL)] patients (N = 78) as compared to non-t(IgL) (N = 717) for progression-free (PFS; left) and overall survival (OS; right). P-values were calculated using a Cox proportional hazards Wald’s test or Bootstrapped based P-value with 1000 permutations based on the hazard ratio. Source data are provided as a Source Data file
Fig. 5
Fig. 5
IgL translocations occur in all gene expression subtypes. a Consensus clustering of 629 newly diagnosed myelomas with whole genome sequencing and RNA-seq. Expression subtypes are denoted by gray annotation bars (top and left), and labels correspond with those defined by Zhan et al.. The number of samples are denoted on the right. b Frequency of gene expression subtypes in all myelomas (gray) and in t(IgL) myeloma (black). c Heatmap of genes differentially expressed in t(IgL) myeloma as compared to others. Samples (columns) are clustered with t(IgL) status annotated (top; black) and gene significance denoted (left). *P < 0.05; **P < 0.01, two-sided Fisher’s exact test. Source data are provided as a Source Data file
Fig. 6
Fig. 6
IgL translocation co-occurs with hyperdiploid disease. a Heatmap of copy number alterations (CNA) in 777 newly diagnosed myelomas (rows) with genomic location (columns; 100 kb bins) labelled by chromosome (top). Hyperdiploid (HD) disease, and t(11;14), t(4;14), and t(14;16) translocations are annotated (left) as well as t(IgL) (right). b Frequency of common CNA in all newly diagnosed myeloma (gray) and myelomas with t(IgL) (black). **P < 0.01, Fisher’s exact test. c Progression-free (PFS; gray) and overall survival (OS; black) hazard ratios determined by multivariate survival analysis of common CNA and t(IgL) with 95% confidence intervals shown. d Kaplan-Meier survival analysis of patients with amplification of 1q [amp(1q)] (blue), without amp(1q) (gray), or both amp(1q) and t(IgL) (red). e Same as part d except shown for HD. P-values denote the survival difference between the specified CNA (blue) and the CNA + t(IgL) (red) relative to the ‘other’ group as determined by a Cox proportional hazards Wald’s test. Source data are provided as a Source Data file
Fig. 7
Fig. 7
IgL translocated myelomas do not benefit from IMiDs. a Progression-free (PFS; left) and overall survival (OS; right) Kaplan-Meier curves for non-t(IgL) patients with (green; N = 463) or without (gray; N = 164) front-line IMiD containing therapy (PFS P = 3.3 × 10−7; OS P = 1.1 × 10−6), as well as t(IgL) patients with (blue; N = 51) and without (red; N = 23) front-line IMiD therapy (PFS P = 0.51; OS P = 0.19). b PFS (left) and OS (right) hazard ratios (HR) for the populations defined in part a. c PFS and OS as in part a except comparing non-t(IgH) patients with (green; N = 301) and without (gray; N = 111) front-line IMiD therapy (PFS P = 7.4 × 10−4; OS P = 1.7 × 10−3) as well as t(IgH) patients with (blue; N = 213) and without (red; N = 76) front-line IMiD therapy (PFS P = 1.5 × 10−4; OS P = 8.0 × 10−5). d PFS (left) and OS (right) hazard ratios (HR) for the populations defined in part c. P-values were calculated using a Cox proportional hazards Wald’s test. Hazard ratios in parts b and d were calculated relative to all other patients and 95% confidence intervals are shown. Source data are provided as a Source Data file

References

    1. Attal M, et al. A Prospective, randomized trial of autologous bone marrow transplantation and chemotherapy in multiple myeloma. N. Engl. J. Med. 1996;335:91–97. doi: 10.1056/NEJM199607113350204. - DOI - PubMed
    1. Richardson PG, et al. Bortezomib or high-dose dexamethasone for relapsed multiple myeloma. N. Engl. J. Med. 2005;352:2487–2498. doi: 10.1056/NEJMoa043445. - DOI - PubMed
    1. Singhal S, et al. Antitumor activity of thalidomide in refractory multiple myeloma. N. Engl. J. Med. 1999;341:1565–1571. doi: 10.1056/NEJM199911183412102. - DOI - PubMed
    1. Weber DM, et al. Lenalidomide plus dexamethasone for relapsed multiple myeloma in North America. N. Engl. J. Med. 2007;357:2133–2142. doi: 10.1056/NEJMoa070596. - DOI - PubMed
    1. Dimopoulos M, et al. Lenalidomide plus dexamethasone for relapsed or refractory multiple myeloma. N. Engl. J. Med. 2007;357:2123–2132. doi: 10.1056/NEJMoa070594. - DOI - PubMed

Publication types

MeSH terms